. 2009 Jan 1;43(1):170-181.
doi: 10.1016/j.atmosenv.2008.09.025.

Endocrine disrupting chemicals in indoor and outdoor air

Affiliations

Endocrine disrupting chemicals in indoor and outdoor air

Ruthann A Rudel et al. Atmos Environ (1994). .

Abstract

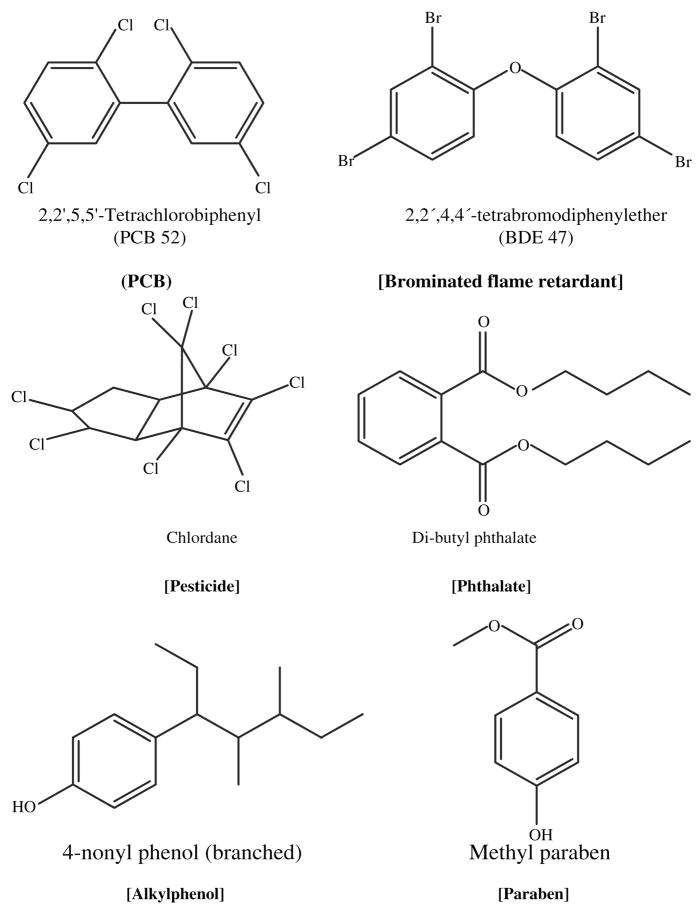
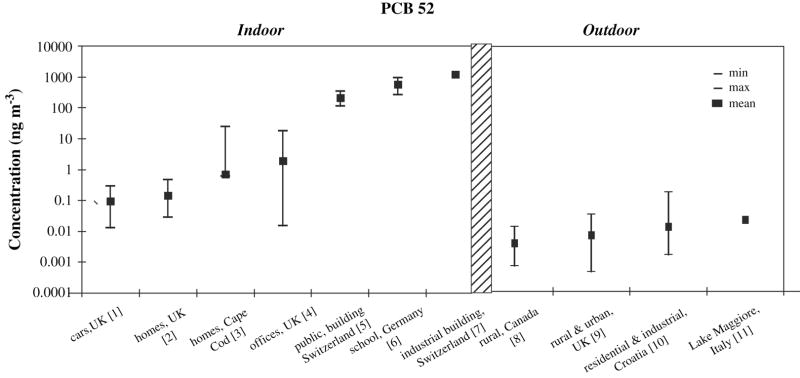
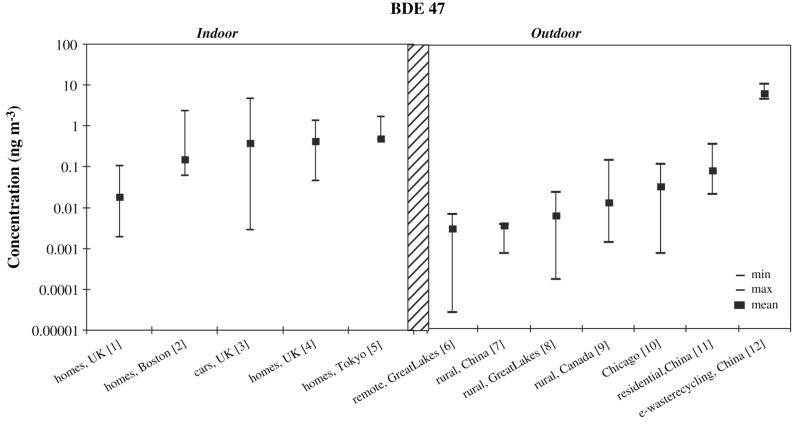
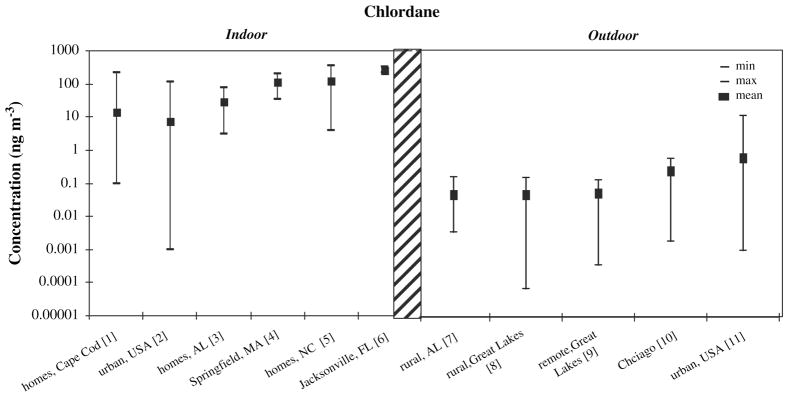
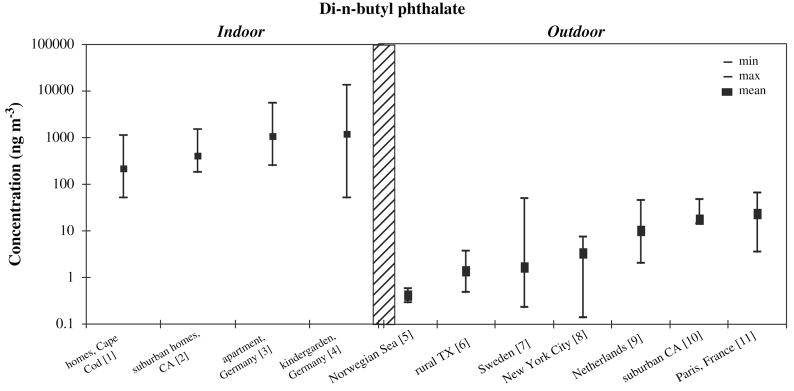
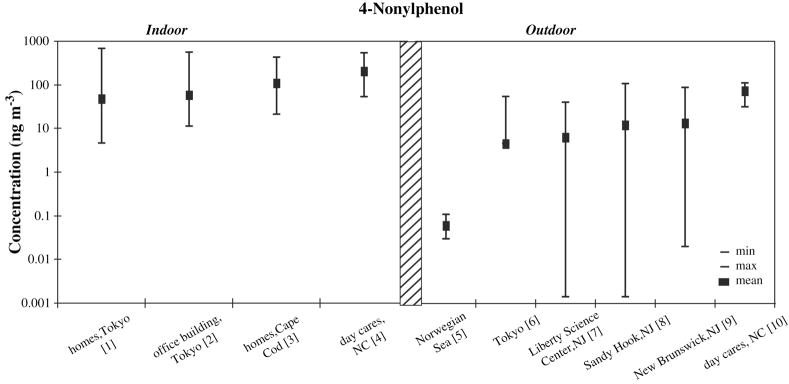
The past 50 years have seen rapid development of new building materials, furnishings, and consumer products and a corresponding explosion in new chemicals in the built environment. While exposure levels are largely undocumented, they are likely to have increased as a wider variety of chemicals came into use, people began spending more time indoors, and air exchange rates decreased to improve energy efficiency. As a result of weak regulatory requirements for chemical safety testing, only limited toxicity data are available for these chemicals. Over the past 15 years, some chemical classes commonly used in building materials, furnishings, and consumer products have been shown to be endocrine disrupting chemicals-that is they interfere with the action of endogenous hormones. These include PCBs, used in electrical equipment, caulking, paints and surface coatings; chlorinated and brominated flame retardants, used in electronics, furniture, and textiles; pesticides, used to control insects, weeds, and other pests in agriculture, lawn maintenance, and the built environment; phthalates, used in vinyl, plastics, fragrances, and other products; alkylphenols, used in detergents, pesticide formulations, and polystyrene plastics; and parabens, used to preserve products like lotions and sunscreens. This paper summarizes reported indoor and outdoor air concentrations, chemical use and sources, and toxicity data for each of these chemical classes. While industrial and transportation-related pollutants have been shown to migrate indoors from outdoor sources, it is expected that indoor sources predominate for these consumer product chemicals; and some studies have identified indoor sources as the predominant factor influencing outdoor ambient air concentrations in densely populated areas. Mechanisms of action, adverse effects, and dose-response relationships for many of these chemicals are poorly understood and no systematic screening of common chemicals for endocrine disrupting effects is currently underway, so questions remain as to the health impacts of these exposures.


Figures

Figure 1
Figure 1
Figure 2
Figure 2
[1] (Harrad et al., 2006; Harrad. personal communication), n = 24, gas phase only [2] (Harrad et al., 2006; Harrad, personal communication), n = 31, gas phase only [3] (Rudel et al.. 2003: Rudel, personal communication), n = 120, median (not mean) plotted [4] (Harrad et al., 2006; Harrad, personal communication), n = 32, gas phase only [5] (Kohler et al., 2002), n = 4 [6] (Gabrio et al., 2000), n = 5 [7] (Kohler et al., 2002), n =1 [8] (Su et al.. 2007), n = 67, gas phase only [9] (Jamshidi et al., 2007), n = 110, gas phase only [10] (Romanic and Krauthacker, 2007), n = 80, median (not mean) plotted [11] (Vives et al., 2007), n = 1
Figure 3
Figure 3
[1] (Harrad et al, 2006; Harrad, personal communication), n = 31, gas phase only [2] (Allen et al., 2007), n = 40 [3] (Harrad et al., 2006; Harrad, personal communication), n = 25, gas phase only [4] (Harrad et al., 2004), n = 7 [5] (Saito et al., 2007), n = 18, median (not mean) plotted [6] (Strandberg et al., 2001; Basu, personal communication), n = 12 [7] (Deng et al., 2007; Deng, personal communication), n = 30, TSP [8] (Strandberg et al., 2001; Basu, personal communication), n = 24 [9] (Su et al., 2007), n = 32 [10] (Strandberg et al., 2001; Basu, personal communication), n = 12 [11] (Deng et al, 2007; Deng, personal communication), n = 30, TSP [12] (Deng et al., 2007; Deng, personal communication), n = 30, TSP
Figure 4
Figure 4
[1] (Rudel el al.. 2003), n = 120, sum of trans-chlordane, cis-chlordane. and heptachlor [2] (Offenberg et al., 2004), n = 126, sum of trans-chlordane, cis-chlordane, trans-nonachlor, and cis-nonachlor [3] (Jantunen et al., 2000; Jantunen, 2008), n = 5. trans-chlordane only [4] (Whitmore et al., 1994), n = 85. min, max, and mean are from seasonal averages [5] (Lewis et al., 1994), n = 8, [6] (Whitmore et al.. 1994), n = 175. min, max, and mean are from seasonal averages [7] (Jantunen et al., 2000), n = 25, trans-chlordane only [8] (Strandberg et al., 2001; Basu, personal communication), n = 12 [9] (Strandberg et al, 2001; Basu, personal communication), n = 12 [10] (Strandberg et al., 2001; Basu, personal communication), n = 12 [11] (Offenberg et al., 2004), n = 95, sum of trans-chlordane, cis-chlordane, trans-nonachlor, and cis-nonachlor
Figure 5
Figure 5
[1] (Rudel et al., 2003), n = 120, median (not mean) plotted [2] (Sheldon et al., 1992), n = 104, range shown is 10th to 90lh percentile, median (not mean) plotted [3] (Fromme et al., 2004), n = 59, median (not mean) plotted [4] (Fromme et al., 2004), n = 74, median (not mean) plotted [5] (Xie et al., 2007), n = 6 [6] (Atlas and Giam, 1988), n =13 [7] (Thuren and Larsson, 1990), n = 51, median (not mean) plotted [8] (Bove et al., 1978), n = 138, particulate phase only, min and max from monthly averages, median (not mean) plotted [9] (Peijnenburg and Struijs, 2006), n = 32, range shown is MQL to 95th percentile, gas phase only, median (not mean) plotted [10] (Sheldon et al., 1992), n = 36, range shown is MQL to 90th percentile, median (not mean) plotted [11] (Teil et al., 2006), n = 20
Figure 6
Figure 6
[1] (Saito et al., 2007), n = 90, median (not mean) plotted [2] (Saito et al., 2007), n = 38, median (not mean) plotted [3] (Rudel et al., 2003), n = 120, median (not mean) plotted [4] (Wilson et al., 2001), n = 9 [5] (Xie et al., 2006), n = 6, gas phase only, sum of branched 4-nonylphenol isomers [6] (Saito et al., 2004), n = 33, median (not mean) plotted [7] (Van Ry et al., 2000), n = 23, sum of branched 4-nonylphenol isomers [8] (Van Ry et al., 2000), n =38, sum of branched 4-nonylphenol isomers [9] (Van Ry et al., 2000), n = 27, sum of branched 4-nonylphenol isomers [10] (Wilson et al., 2001), n = 9

References

    1. Adibi J, Whyatt R, et al. Characterization of Phthalate Exposure among Pregnant Women assessed by Repeat Air and Urine Samples. Environmental Health Perspectives 2008 - PMC - PubMed
    1. Adibi JJ, Perera FP, et al. Prenatal exposures to phthalates among women in New York City and Krakow, Poland. Environmental Health Perspectives. 2003;111(14):1719–1722. - PMC - PubMed
    1. Agency for Toxic Substances and Disease Registry. Toxicological Profile for Polychlorinated Biphenyls (PCBs) Atlanta: US Department of Health and Human Services; 2000. - PubMed
    1. Allen JG, McClean MD, et al. Personal exposure to polybrominated diphenyl ethers (PBDEs) in residential indoor air. Environmental Science & Technology. 2007;41(13):4574–9. - PubMed
    1. Arbeitsgemeinschaft PVC und Umwelt e.V. Plasticizers market data. 2006. from http://www.agpu.de.

LinkOut - more resources