EPR and Mössbauer spectroscopy show inequivalent hemes in tryptophan dioxygenase
- PMID: 20047315
- PMCID: PMC4251817
- DOI: 10.1021/ja908851e
EPR and Mössbauer spectroscopy show inequivalent hemes in tryptophan dioxygenase
Abstract
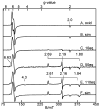
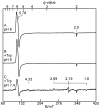
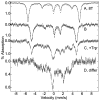
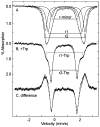
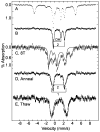
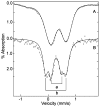
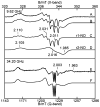
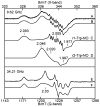
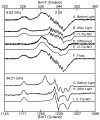
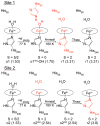
Tryptophan 2,3-dioxygenase (TDO) is an essential enzyme in the pathway of NAD biosynthesis and important for all living organisms. TDO catalyzes oxidative cleavage of the indole ring of L-tryptophan (L-Trp), converting it to N-formylkynurenine (NFK). The crystal structure of TDO shows a dimer of dimer quaternary structure of the homotetrameric protein. The four catalytic sites of the protein, one per subunit, contain a heme that catalyzes the activation and insertion of dioxygen into L-Trp. Because of the alpha(4) structure and because only one type of heme center has been identified in previous spectroscopic studies, the four hemes sites have been presumed to be equivalent. The present work demonstrates that the heme sites of TDO are not equivalent. Quantitative interpretation of EPR and Mössbauer spectroscopic data indicates the presence of two dominant inequivalent heme species in reduced and oxidized states of the enzyme, which is consistent with a dimer of dimer protein quaternary structure that now extends to the electronic properties of the hemes. The electronic properties of the hemes in the reduced state of TDO change significantly upon L-Trp addition, which is attributed to a change in the protonation state of the proximal histidine to the hemes. The binding of O(2) surrogates NO or CO shows two inequivalent heme sites. The heme-NO complexes are 5- and 6-coordinate without L-Trp, and both 6-coordinate with L-Trp. NO can be selectively photodissociated from only one of the heme-NO sites and only in the presence of L-Trp. Cryoreduction of TDO produces a novel diamagnetic heme species, tentatively assigned as a reduced heme-OH complex. This work presents a new description of the heme interactions with the protein, and with the proximal His, which must be considered during the general interpretation of physical data as it relates to kinetics, mechanism, and function of TDO.
Figures


Similar articles
-
Initial O₂ Insertion Step of the Tryptophan Dioxygenase Reaction Proposed by a Heme-Modification Study.Biochemistry. 2015 Jun 16;54(23):3604-16. doi: 10.1021/acs.biochem.5b00048. Epub 2015 Jun 2. Biochemistry. 2015. PMID: 25996254
-
Crystal structure and mechanism of tryptophan 2,3-dioxygenase, a heme enzyme involved in tryptophan catabolism and in quinolinate biosynthesis.Biochemistry. 2007 Jan 9;46(1):145-55. doi: 10.1021/bi0620095. Biochemistry. 2007. PMID: 17198384
-
The heme environment of recombinant human indoleamine 2,3-dioxygenase. Structural properties and substrate-ligand interactions.J Biol Chem. 2002 May 3;277(18):15788-94. doi: 10.1074/jbc.M200457200. Epub 2002 Feb 26. J Biol Chem. 2002. PMID: 11867636
-
Heme-based dioxygenases: Structure, function and dynamics.J Inorg Biochem. 2024 Dec;261:112707. doi: 10.1016/j.jinorgbio.2024.112707. Epub 2024 Aug 30. J Inorg Biochem. 2024. PMID: 39217822 Review.
-
Hypothesis: Metabolic targeting of 5-aminolevulinate synthase by tryptophan and inhibitors of heme utilisation by tryptophan 2,3-dioxygenase as potential therapies of acute hepatic porphyrias.Med Hypotheses. 2019 Oct;131:109314. doi: 10.1016/j.mehy.2019.109314. Epub 2019 Jul 23. Med Hypotheses. 2019. PMID: 31443750 Review.
Cited by
-
Quantitative Interpretation of Multifrequency Multimode EPR Spectra of Metal Containing Proteins, Enzymes, and Biomimetic Complexes.Methods Enzymol. 2015;563:171-208. doi: 10.1016/bs.mie.2015.06.025. Epub 2015 Jul 21. Methods Enzymol. 2015. PMID: 26478486 Free PMC article.
-
A short history of heme dioxygenases: rise, fall and rise again.J Biol Inorg Chem. 2017 Apr;22(2-3):175-183. doi: 10.1007/s00775-016-1412-5. Epub 2016 Dec 1. J Biol Inorg Chem. 2017. PMID: 27909919 Free PMC article. Review.
-
Observing 3-hydroxyanthranilate-3,4-dioxygenase in action through a crystalline lens.Proc Natl Acad Sci U S A. 2020 Aug 18;117(33):19720-19730. doi: 10.1073/pnas.2005327117. Epub 2020 Jul 30. Proc Natl Acad Sci U S A. 2020. PMID: 32732435 Free PMC article.
-
Kinetic and Spectroscopic Characterization of the Catalytic Ternary Complex of Tryptophan 2,3-Dioxygenase.Biochemistry. 2020 Aug 4;59(30):2813-2822. doi: 10.1021/acs.biochem.0c00179. Epub 2020 Jul 23. Biochemistry. 2020. PMID: 32659080 Free PMC article.
-
A novel catalytic heme cofactor in SfmD with a single thioether bond and a bis-His ligand set revealed by a de novo crystal structural and spectroscopic study.Chem Sci. 2021 Jan 22;12(11):3984-3998. doi: 10.1039/d0sc06369j. Chem Sci. 2021. PMID: 34163669 Free PMC article.
References
-
- Kurnasov O, Goral V, Colabroy K, Gerdes S, Anantha S, Osterman A, Begley TP. Chem Biol. 2003;10:1195–1204. - PubMed
-
- Stone TW, Darlington LG. Nat Rev Drug Discovery. 2002;1:609–620. - PubMed
-
- Schwarcz R. Curr Opin Pharmacol. 2004;4:12–17. - PubMed
-
- Robotka H, Toldi J, Vcsei L. Future Neurol. 2008;3:169–188.
-
- Guillemin GJ, Meininger V, Brew BJ. Neurodegener Dis. 2005;2:166–176. - PubMed
Publication types
MeSH terms
Substances
Grants and funding
LinkOut - more resources
Full Text Sources

