

A novel method of production and biophysical characterization of the catalytic domain of yeast oligosaccharyl transferase
- PMID: 20047336
- PMCID: PMC2838725
- DOI: 10.1021/bi902181v
A novel method of production and biophysical characterization of the catalytic domain of yeast oligosaccharyl transferase
Abstract
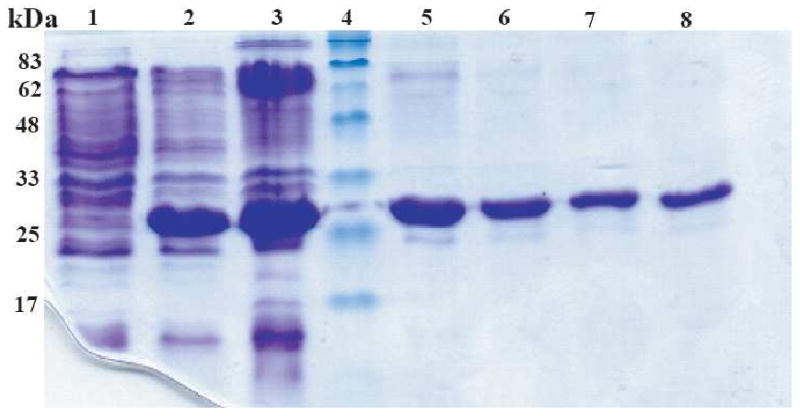
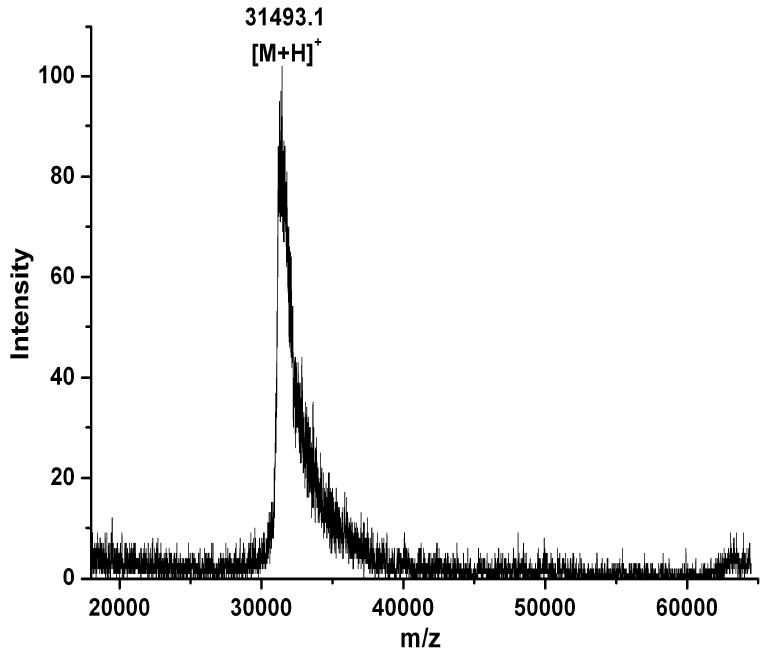
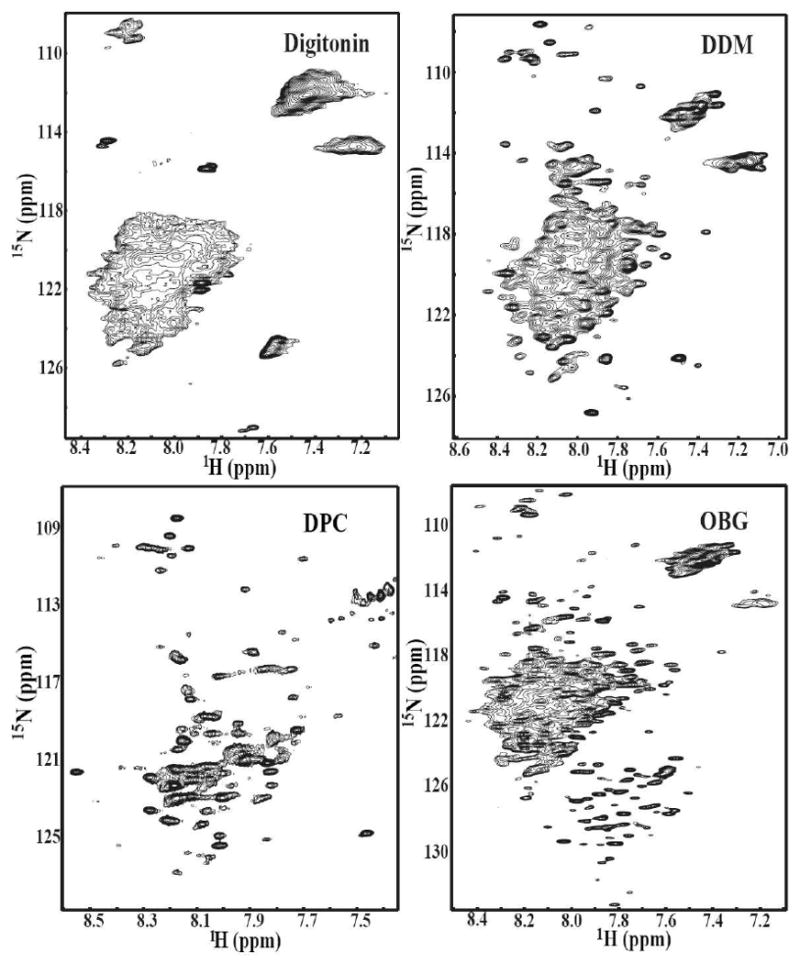
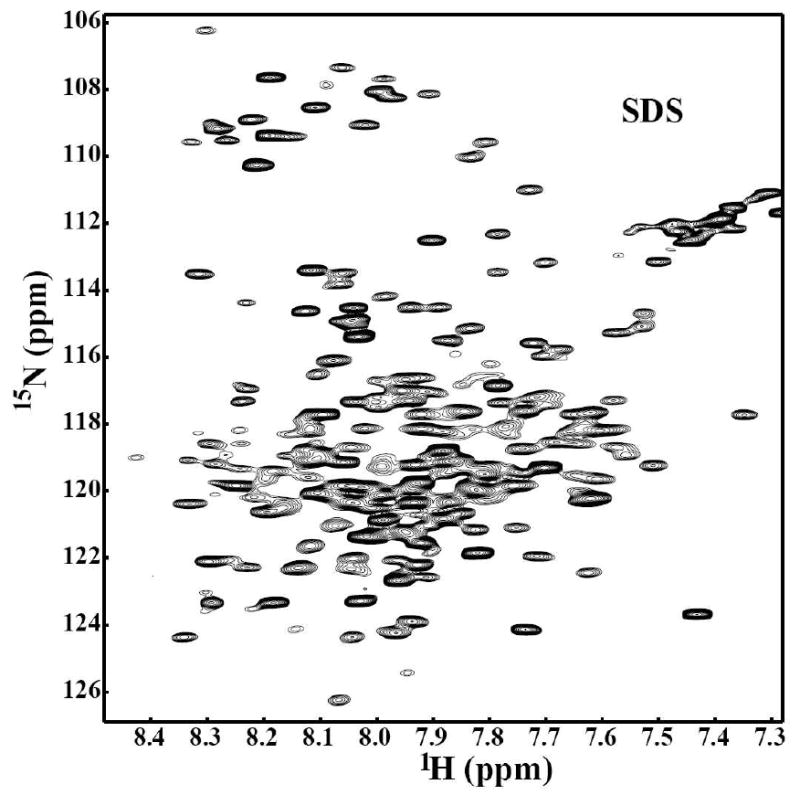
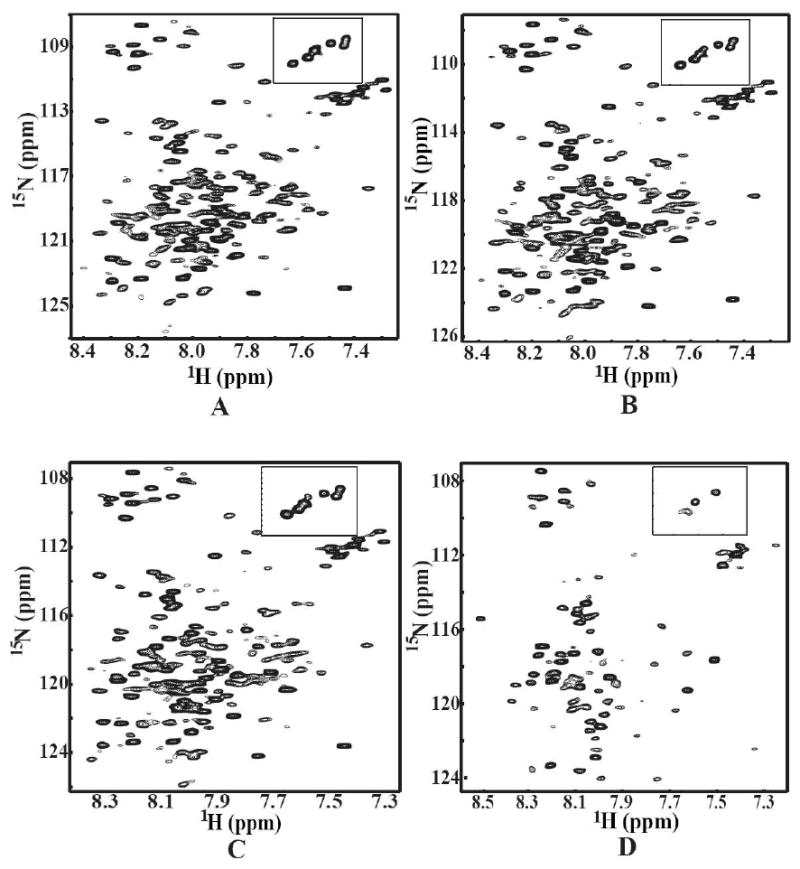
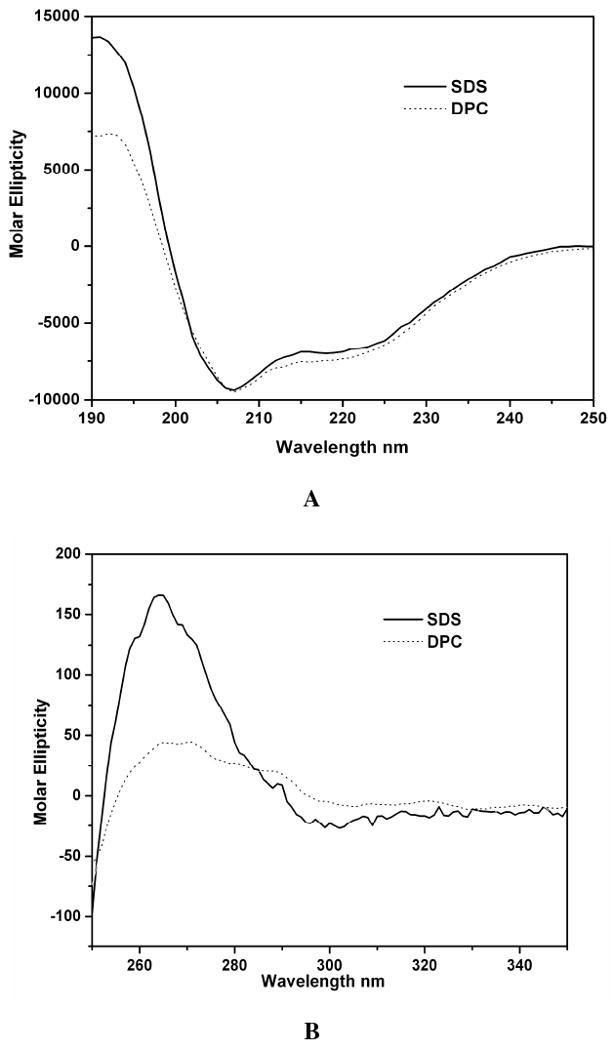
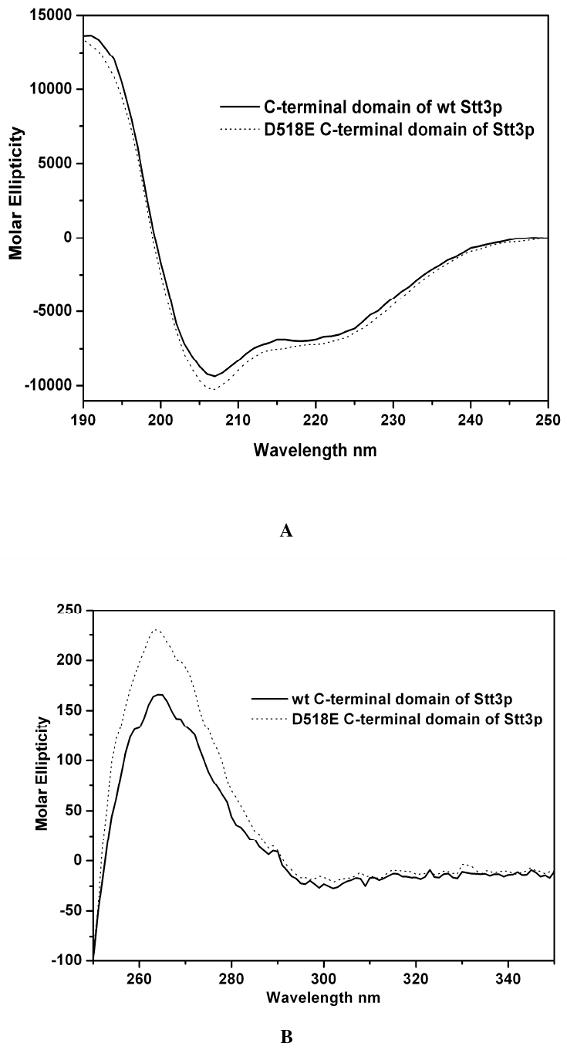
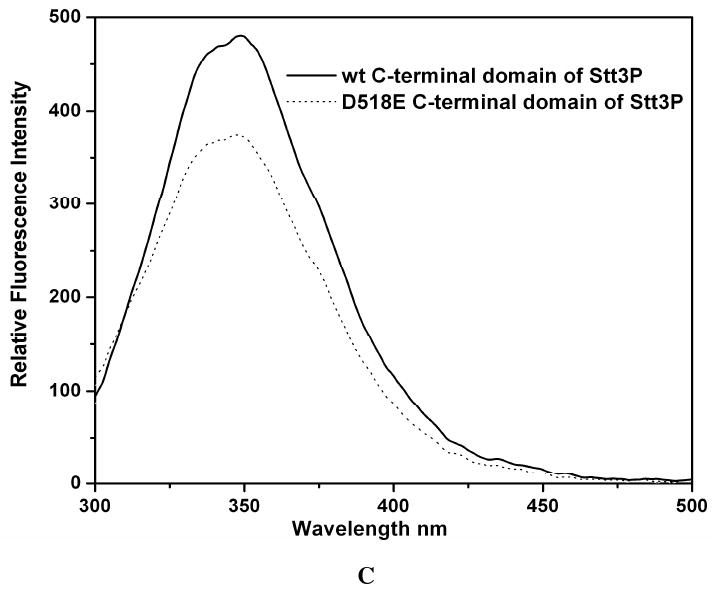
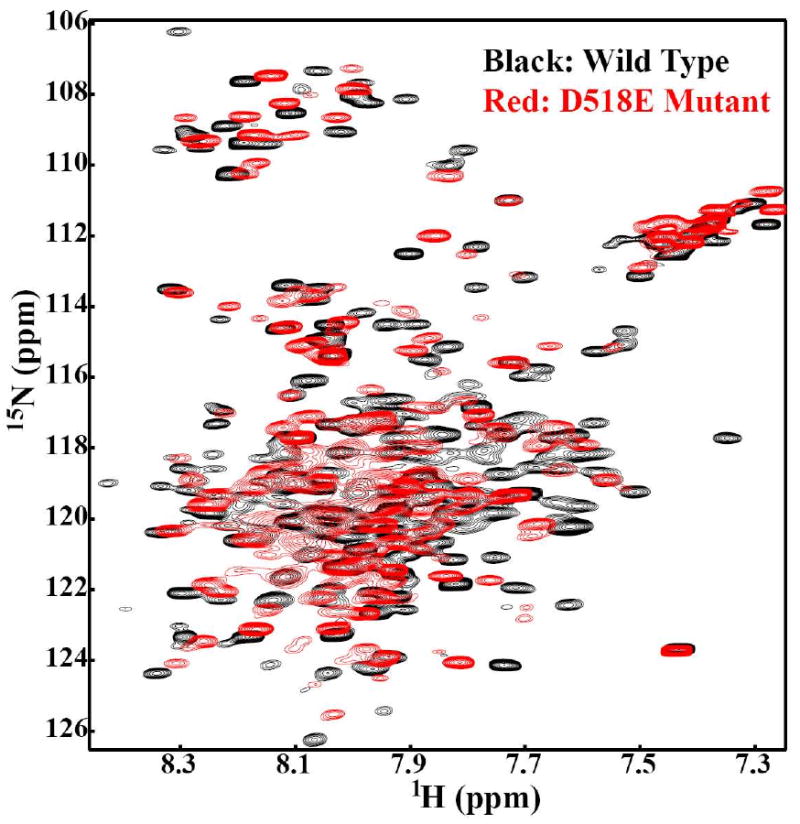
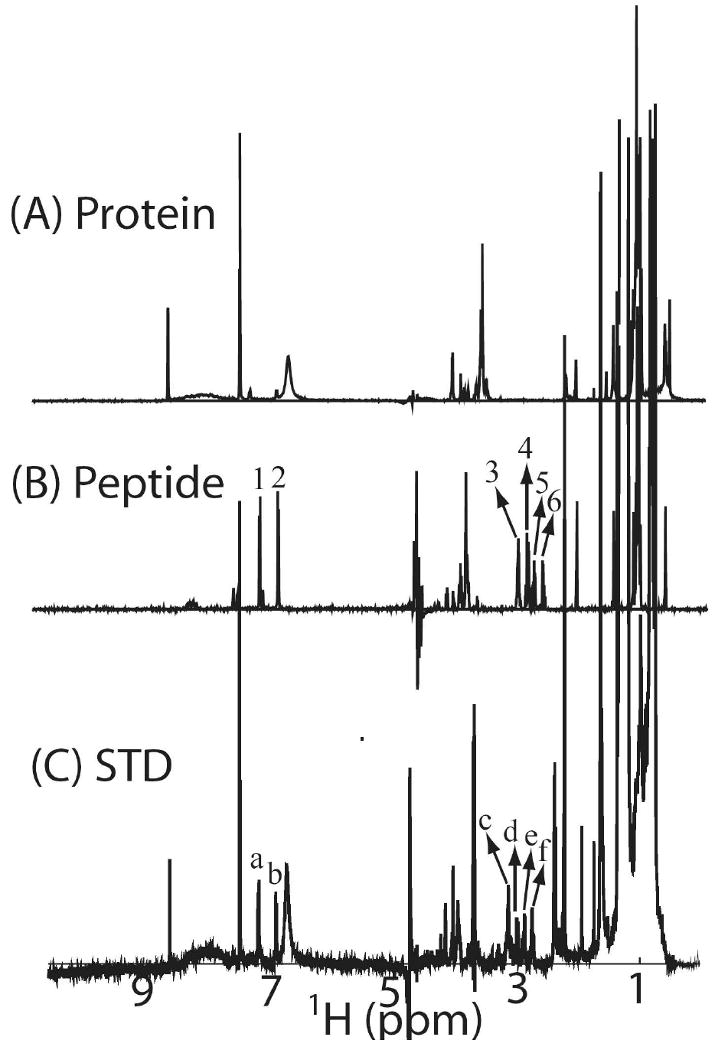
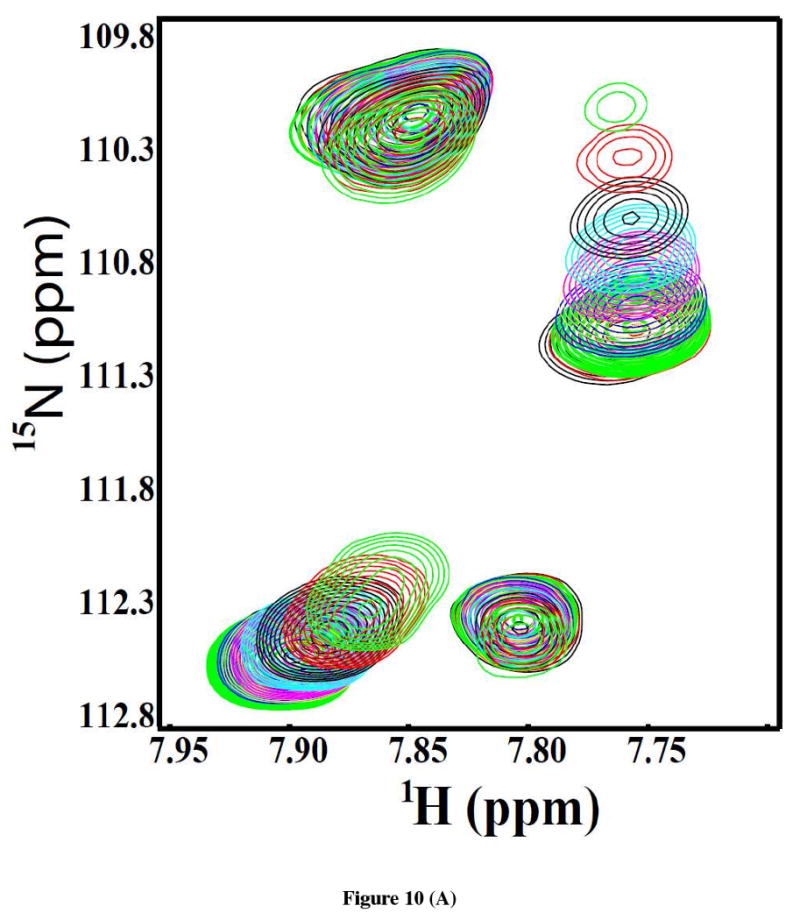
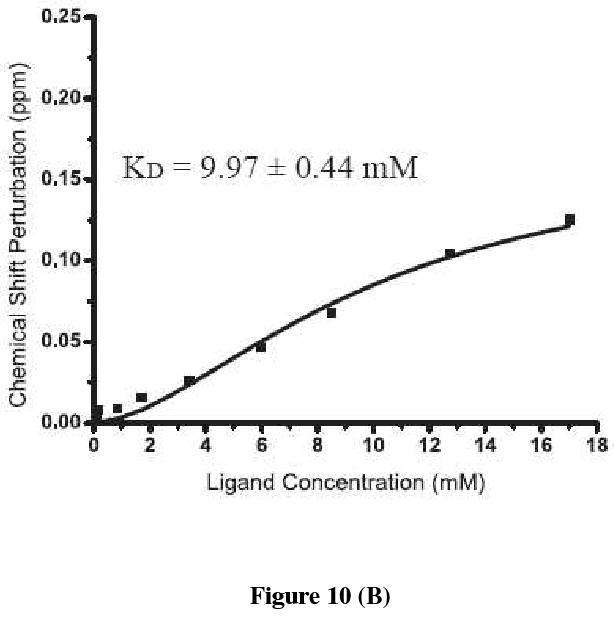
Oligosaccharyl transferase (OT) is a multisubunit enzyme that catalyzes N-linked glycosylation of nascent polypeptides in the lumen of the endoplasmic reticulum. In the case of Saccharomyces cerevisiae, OT is composed of nine integral membrane protein subunits. Defects in N-linked glycosylation cause a series of disorders known as congenital disorders of glycosylation (CDG). The C-terminal domain of the Stt3p subunit has been reported to contain the acceptor protein recognition site and/or catalytic site. We report here the subcloning, overexpression, and a robust but novel method of production of the pure C-terminal domain of Stt3p at 60-70 mg/L in Escherichia coli. CD spectra indicate that the C-terminal Stt3p is highly helical and has a stable tertiary structure in SDS micelles. The well-dispersed two-dimensional (1)H-(15)N HSQC spectrum in SDS micelles indicates that it is feasible to determine the atomic structure by NMR. The effect of the conserved D518E mutation on the conformation of the C-terminal Stt3p is particularly interesting. The replacement of a key residue, Asp(518), located within the WWDYG signature motif (residues 516-520), led to a distinct tertiary structure, even though both proteins have similar overall secondary structures, as demonstrated by CD, fluorescence and NMR spectroscopies. This observation strongly suggests that Asp(518) plays a critical structural role, in addition to the previously proposed catalytic role. Moreover, the activity of the protein was confirmed by saturation transfer difference and nuclear magnetic resonance titration studies.
Figures
Similar articles
-
Eukaryotic N-glycosylation occurs via the membrane-anchored C-terminal domain of the Stt3p subunit of oligosaccharyltransferase.J Biol Chem. 2012 Sep 21;287(39):32450-8. doi: 10.1074/jbc.M112.342253. Epub 2012 Aug 3. J Biol Chem. 2012. PMID: 22865878 Free PMC article.
-
A novel and simple method of production and biophysical characterization of a mini-membrane protein, Ost4p: a subunit of yeast oligosaccharyl transferase.Biopolymers. 2012 Jul;97(7):499-507. doi: 10.1002/bip.22028. Epub 2012 Feb 3. Biopolymers. 2012. PMID: 22302405 Free PMC article.
-
Insight into functional aspects of Stt3p, a subunit of the oligosaccharyl transferase. Evidence for interaction of the N-terminal domain of Stt3p with the protein kinase C cascade.J Biol Chem. 2003 Dec 19;278(51):51441-7. doi: 10.1074/jbc.M310456200. Epub 2003 Oct 6. J Biol Chem. 2003. PMID: 14530272
-
Studies on oligosaccharyl transferase in yeast.Acta Biochim Pol. 2007;54(4):673-7. Epub 2007 Dec 13. Acta Biochim Pol. 2007. PMID: 18080018 Review.
-
Structural Insight into the Mechanism of N-Linked Glycosylation by Oligosaccharyltransferase.Biomolecules. 2020 Apr 17;10(4):624. doi: 10.3390/biom10040624. Biomolecules. 2020. PMID: 32316603 Free PMC article. Review.
Cited by
-
The oligosaccharyl transferase subunit STT3 mediates fungal development and is required for virulence in Verticillium dahliae.Curr Genet. 2018 Feb;64(1):235-246. doi: 10.1007/s00294-017-0729-0. Epub 2017 Aug 10. Curr Genet. 2018. PMID: 28798981
-
Challenging the limit: NMR assignment of a 31 kDa helical membrane protein.J Am Chem Soc. 2010 Mar 24;132(11):3662-3. doi: 10.1021/ja100078z. J Am Chem Soc. 2010. PMID: 20178386 Free PMC article.
-
Eukaryotic N-glycosylation occurs via the membrane-anchored C-terminal domain of the Stt3p subunit of oligosaccharyltransferase.J Biol Chem. 2012 Sep 21;287(39):32450-8. doi: 10.1074/jbc.M112.342253. Epub 2012 Aug 3. J Biol Chem. 2012. PMID: 22865878 Free PMC article.
-
A novel and simple method of production and biophysical characterization of a mini-membrane protein, Ost4p: a subunit of yeast oligosaccharyl transferase.Biopolymers. 2012 Jul;97(7):499-507. doi: 10.1002/bip.22028. Epub 2012 Feb 3. Biopolymers. 2012. PMID: 22302405 Free PMC article.
References
-
- Knauer R, Lehle L. The Oligosaccharyltransferase Complex from Saccharomyces cerevisiae. Biochim Biophys Acta. 1999;1426:259–273. - PubMed
-
- Silberstein S, Gilmore R. Biochemistry, molecular biology, and genetics of the oligosaccharyltransferase. FASEB J. 1996;10:849–858. - PubMed
-
- Welply JK, Shenbagamurthi P, Lennarz WJ, Naider F. Substrate recognition by oligosaccharyltransferase. Studies on glycosylation of modified Asn-X-Thr/Ser tripeptides. J Biol Chem. 1983;258:11856–11863. - PubMed
-
- Dempski RE, Jr, Imperiali B. Oligosaccharyl transferase: gatekeeper to the secretory pathway. Curr Opin Chem Biol. 2002;6:844–850. - PubMed
-
- Helenius A, Aebi M. Roles of N-linked glycans in the endoplasmic reticulum. Annu Rev Biochem. 2004;73:1019–1049. - PubMed
Publication types
MeSH terms
Substances
Grants and funding
LinkOut - more resources
Full Text Sources
Molecular Biology Databases
