

Standing variation and new mutations both contribute to a fast response to selection for flowering time in maize inbreds
- PMID: 20047647
- PMCID: PMC2837650
- DOI: 10.1186/1471-2148-10-2
Standing variation and new mutations both contribute to a fast response to selection for flowering time in maize inbreds
Abstract
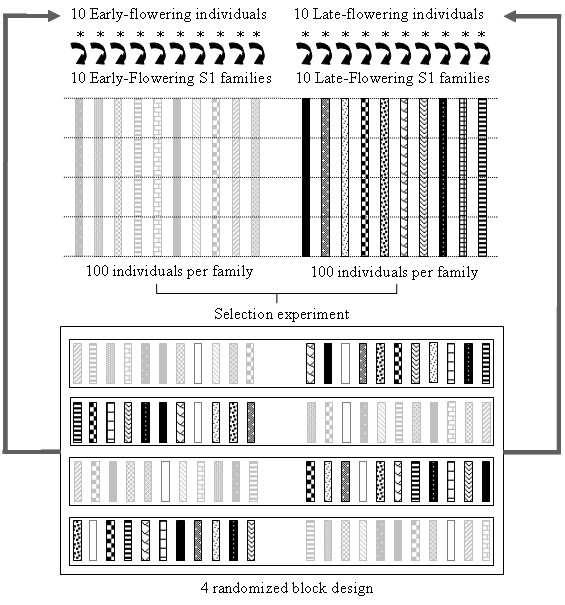
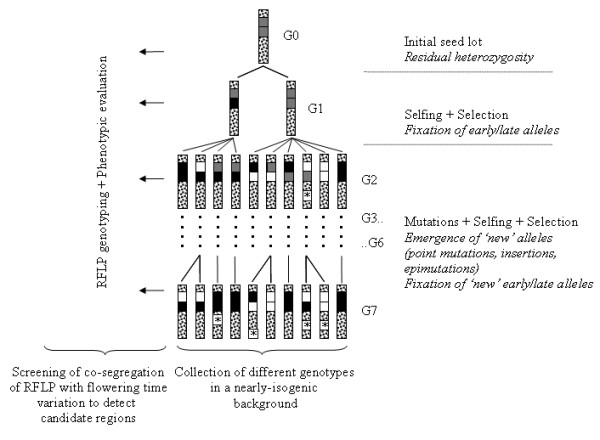
Background: In order to investigate the rate and limits of the response to selection from highly inbred genetic material and evaluate the respective contribution of standing variation and new mutations, we conducted a divergent selection experiment from maize inbred lines in open-field conditions during 7 years. Two maize commercial seed lots considered as inbred lines, F252 and MBS847, constituted two biological replicates of the experiment. In each replicate, we derived an Early and a Late population by selecting and selfing the earliest and the latest individuals, respectively, to produce the next generation.
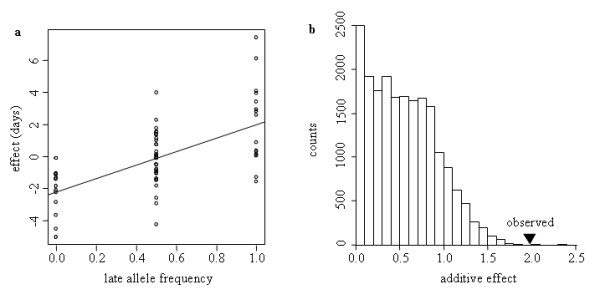
Results: All populations, except the Early MBS847, responded to selection despite a short number of generations and a small effective population size. Part of the response can be attributed to standing genetic variation in the initial seed lot. Indeed, we identified one polymorphism initially segregating in the F252 seed lot at a candidate locus for flowering time, which explained 35% of the trait variation within the Late F252 population. However, the model that best explained our data takes into account both residual polymorphism in the initial seed lots and a constant input of heritable genetic variation by new (epi)mutations. Under this model, values of mutational heritability range from 0.013 to 0.025, and stand as an upper bound compare to what is reported in other species.
Conclusions: Our study reports a long-term divergent selection experiment for a complex trait, flowering time, conducted on maize in open-field conditions. Starting from a highly inbred material, we created within a few generations populations that strikingly differ from the initial seed lot for flowering time while preserving most of the phenotypic characteristics of the initial inbred. Such material is unique for studying the dynamics of the response to selection and its determinants. In addition to the fixation of a standing beneficial mutation associated with a large phenotypic effect, a constant input of genetic variance by new mutations has likely contributed to the response. We discuss our results in the context of the evolution and mutational dynamics of populations characterized by a small effective population size.
Figures
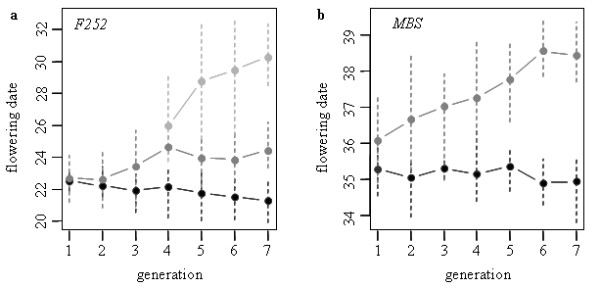
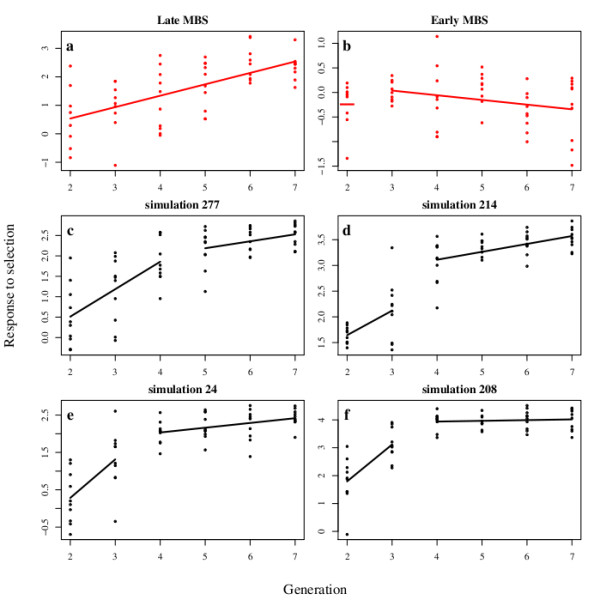
 = 0.02841 estimated from the observed data of the Late MBS population with Model 2 (no input of de novo mutation see text for the details), and nP = 100 and nH = 60. The four examples were chosen among those that display the same average response to selection over the seven generations. (c) The best model is provided by a breakpoint at generation 4 leading to two segments, the first between generations 2 to 4 and the second between generations 5 to 7. (d to f) The best models are provided by a breakpoint at generation 3 leading to two segments, the first between generations 2 to 3 and the second between generations 4 to 7. In (f), the second segment is horizontal and corresponds to a plateau.
Similar articles
-
Dearth of polymorphism associated with a sustained response to selection for flowering time in maize.BMC Evol Biol. 2015 Jun 7;15:103. doi: 10.1186/s12862-015-0382-5. BMC Evol Biol. 2015. PMID: 26049736 Free PMC article.
-
Flowering time in maize: linkage and epistasis at a major effect locus.Genetics. 2012 Apr;190(4):1547-62. doi: 10.1534/genetics.111.136903. Epub 2012 Jan 31. Genetics. 2012. PMID: 22298708 Free PMC article.
-
Interplay between extreme drift and selection intensities favors the fixation of beneficial mutations in selfing maize populations.Genetics. 2021 Oct 2;219(2):iyab123. doi: 10.1093/genetics/iyab123. Genetics. 2021. PMID: 34849881 Free PMC article.
-
Marker-assisted selection to improve drought adaptation in maize: the backcross approach, perspectives, limitations, and alternatives.J Exp Bot. 2007;58(2):351-60. doi: 10.1093/jxb/erl214. Epub 2006 Dec 6. J Exp Bot. 2007. PMID: 17158111 Review.
-
Genomic screening for artificial selection during domestication and improvement in maize.Ann Bot. 2007 Nov;100(5):967-73. doi: 10.1093/aob/mcm173. Epub 2007 Aug 18. Ann Bot. 2007. PMID: 17704539 Free PMC article. Review.
Cited by
-
Evolution of anticipatory effects mediated by epigenetic changes.Environ Epigenet. 2022 Apr 22;8(1):dvac007. doi: 10.1093/eep/dvac007. eCollection 2022. Environ Epigenet. 2022. PMID: 35475265 Free PMC article.
-
Genomics of Long- and Short-Term Adaptation in Maize and Teosintes.Methods Mol Biol. 2020;2090:289-311. doi: 10.1007/978-1-0716-0199-0_12. Methods Mol Biol. 2020. PMID: 31975172 Review.
-
Two maize cultivars of contrasting leaf size show different leaf elongation rates with identical patterns of extension dynamics and coordination.AoB Plants. 2021 Jan 4;13(1):plaa072. doi: 10.1093/aobpla/plaa072. eCollection 2021 Feb. AoB Plants. 2021. PMID: 33604014 Free PMC article.
-
A successive time-to-event model of phyllochron dynamics for hypothesis testing: application to the analysis of genetic and environmental effects in maize.Plant Methods. 2023 Jun 7;19(1):54. doi: 10.1186/s13007-023-01029-7. Plant Methods. 2023. PMID: 37287031 Free PMC article.
-
Darwinism for the Genomic Age: Connecting Mutation to Diversification.Front Genet. 2017 Feb 7;8:12. doi: 10.3389/fgene.2017.00012. eCollection 2017. Front Genet. 2017. PMID: 28224003 Free PMC article.
References
-
- Crow JF, Kimura M. Introduction to Population Genetics Theory. Harper & Row Publishers, New York; 1970.
Publication types
MeSH terms
LinkOut - more resources
Full Text Sources
