

The Plasmodium falciparum merozoite surface protein-1 19 KD antibody response in the Peruvian Amazon predominantly targets the non-allele specific, shared sites of this antigen
- PMID: 20047674
- PMCID: PMC2818648
- DOI: 10.1186/1475-2875-9-3
The Plasmodium falciparum merozoite surface protein-1 19 KD antibody response in the Peruvian Amazon predominantly targets the non-allele specific, shared sites of this antigen
Abstract
Background: Plasmodium falciparum re-emerged in Iquitos, Peru in 1994 and is now hypoendemic (< 0.5 infections/person/year). Purportedly non-immune individuals with discrete (non-overlapping) P. falciparum infections can be followed using this population dynamic. Previous work demonstrated a strong association between this population's antibody response to PfMSP1-19KD and protection against febrile illness and parasitaemia. Therefore, some selection for PfMSP1-19KD allelic diversity would be expected if the protection is to allele-specific sites of PfMSP1-19KD. Here, the potential for allele-specific polymorphisms in this population is investigated, and the allele-specificity of antibody responses to PfMSP1-19KD are determined.
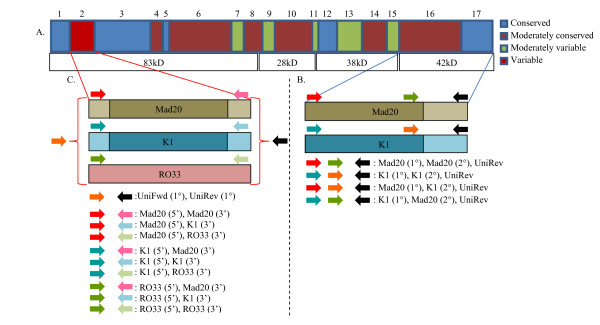
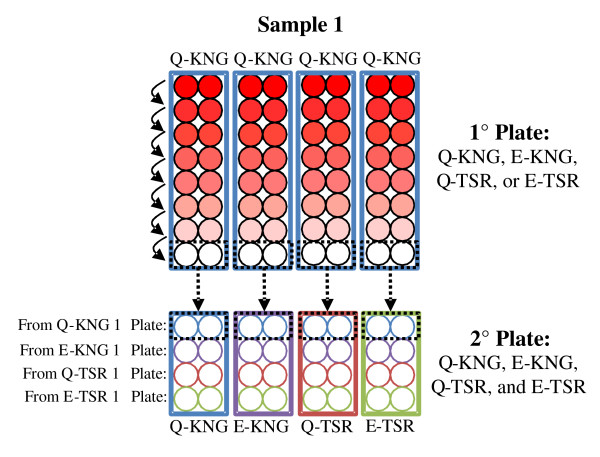
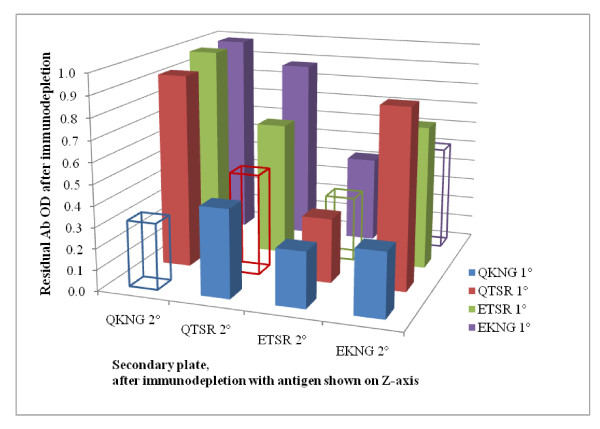
Methods: The 42KD region in PfMSP1 was genotyped from 160 individual infections collected between 2003 and 2007. Additionally, the polymorphic block 2 region of Pfmsp1 (Pfmsp1-B2) was genotyped in 781 infection-months to provide a baseline for population-level diversity. To test whether PfMSP1-19KD genetic diversity had any impact on antibody responses, ELISAs testing IgG antibody response were performed on individuals using all four allele-types of PfMSP1-19KD. An antibody depletion ELISA was used to test the ability of antibodies to cross-react between allele-types.
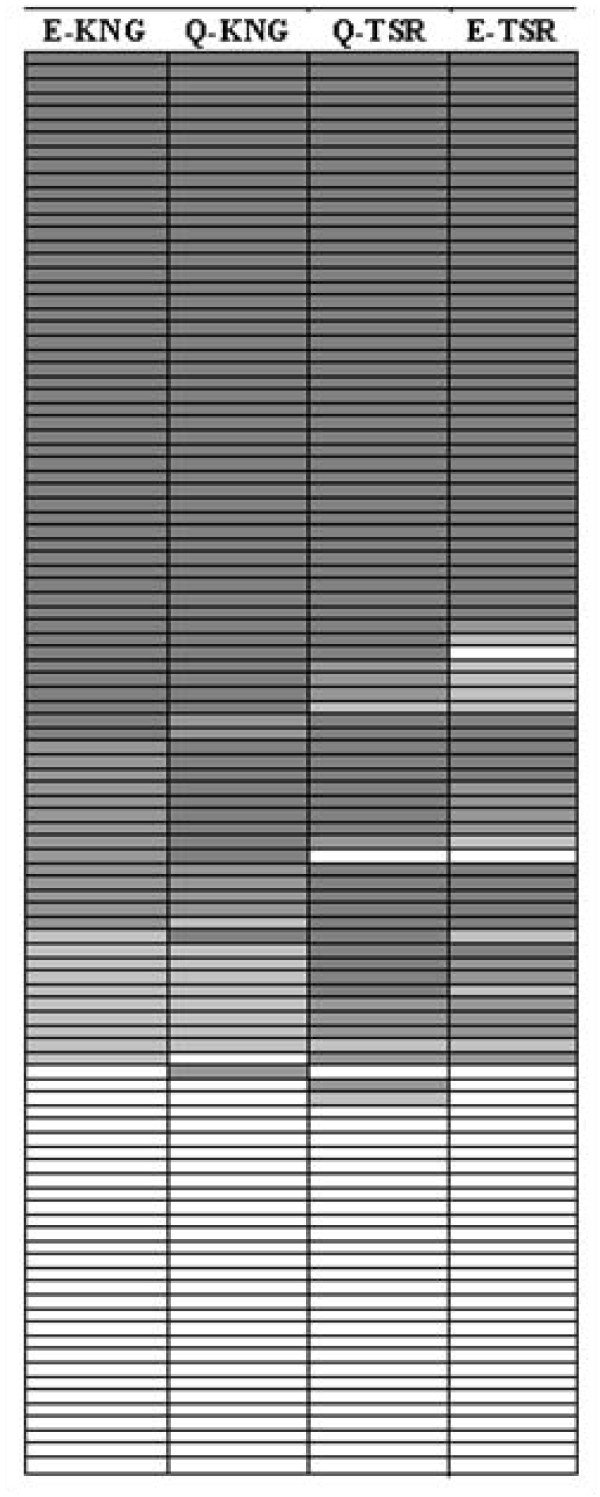
Results: Despite increased diversity in Pfmsp1-B2, limited diversity within Pfmsp1-42KD was observed. All 160 infections genotyped were Mad20-like at the Pfmsp1-33KD locus. In the Pfmsp1-19KD locus, 159 (99.4%) were the Q-KSNG-F haplotype and 1 (0.6%) was the E-KSNG-L haplotype. Antibody responses in 105 individuals showed that Q-KNG and Q-TSR alleles generated the strongest immune responses, while Q-KNG and E-KNG responses were more concordant with each other than with those from Q-TSR and E-TSR, and vice versa. The immuno-depletion ELISAs showed all samples responded to the antigenic sites shared amongst all allelic forms of PfMSP1-19KD.
Conclusions: A non-allele specific antibody response in PfMSP1-19KD may explain why other allelic forms have not been maintained or evolved in this population. This has important implications for the use of PfMSP1-19KD as a vaccine candidate. It is possible that Peruvians have increased antibody responses to the shared sites of PfMSP1-19KD, either due to exposure/parasite characteristics or due to a human-genetic predisposition. Alternatively, these allelic polymorphisms are not immune-specific even in other geographic regions, implying these polymorphisms may be less important in immune evasion that previous studies suggest.
Figures
Similar articles
-
Non-variant specific antibody responses to the C-terminal region of merozoite surface protein-1 of Plasmodium falciparum (PfMSP-1(19)) in Iranians exposed to unstable malaria transmission.Malar J. 2010 Sep 16;9:257. doi: 10.1186/1475-2875-9-257. Malar J. 2010. PMID: 20846388 Free PMC article.
-
Antibody response dynamics to the Plasmodium falciparum conserved vaccine candidate antigen, merozoite surface protein-1 C-terminal 19kD (MSP1-19kD), in Peruvians exposed to hypoendemic malaria transmission.Malar J. 2008 Sep 9;7:173. doi: 10.1186/1475-2875-7-173. Malar J. 2008. PMID: 18782451 Free PMC article.
-
Human IgG subclass antibodies to the 19 kilodalton carboxy terminal fragment of Plasmodium falciparum merozoite surface protein 1 (MSP1(19)) and predominance of the MAD20 allelic type of MSP1 in Uganda.East Afr Med J. 2000 Apr;77(4):189-93. doi: 10.4314/eamj.v77i4.46620. East Afr Med J. 2000. PMID: 12858901
-
Stable Plasmodium falciparum merozoite surface protein-1 allelic diversity despite decreasing parasitaemia in children with multiple malaria infections.Malar J. 2025 Apr 28;24(1):136. doi: 10.1186/s12936-025-05378-7. Malar J. 2025. PMID: 40296022 Free PMC article.
-
Population diversity and antibody selective pressure to Plasmodium falciparum MSP1 block2 locus in an African malaria-endemic setting.BMC Microbiol. 2009 Oct 15;9:219. doi: 10.1186/1471-2180-9-219. BMC Microbiol. 2009. PMID: 19832989 Free PMC article.
Cited by
-
Longevity of Genotype-Specific Immune Responses to Plasmodium falciparum Merozoite Surface Protein 1 in Kenyan Children from Regions of Different Malaria Transmission Intensity.Am J Trop Med Hyg. 2016 Sep 7;95(3):580-7. doi: 10.4269/ajtmh.15-0710. Epub 2016 Aug 1. Am J Trop Med Hyg. 2016. PMID: 27481054 Free PMC article.
-
Sexual recombination is a signature of a persisting malaria epidemic in Peru.Malar J. 2011 Oct 31;10:329. doi: 10.1186/1475-2875-10-329. Malar J. 2011. PMID: 22039962 Free PMC article.
-
Anti-Plasmodium falciparum invasion ligand antibodies in a low malaria transmission region, Loreto, Peru.Malar J. 2012 Oct 30;11:361. doi: 10.1186/1475-2875-11-361. Malar J. 2012. PMID: 23110555 Free PMC article.
-
Quantification of Plasmodium falciparum malaria from complex infections in the Peruvian Amazon using quantitative PCR of the merozoite surface protein 1, block 2 (PfMSP1-B2): in vitro dynamics reveal density-dependent interactions.Parasitology. 2012 May;139(6):701-8. doi: 10.1017/S0031182011002393. Epub 2012 Feb 20. Parasitology. 2012. PMID: 22339946 Free PMC article.
-
Non-variant specific antibody responses to the C-terminal region of merozoite surface protein-1 of Plasmodium falciparum (PfMSP-1(19)) in Iranians exposed to unstable malaria transmission.Malar J. 2010 Sep 16;9:257. doi: 10.1186/1475-2875-9-257. Malar J. 2010. PMID: 20846388 Free PMC article.
References
-
- Holder AA, Blackman MJ, Burghaus PA, Chappel JA, Ling IT, McCallum-Deighton N, Shai S. A malaria merozoite surface protein (MSP1)-structure, processing and function. Mem Inst Oswaldo Cruz. 1992;87(Suppl III):37–42. - PubMed
Publication types
MeSH terms
Substances
Grants and funding
LinkOut - more resources
Full Text Sources
Research Materials
Miscellaneous
