. 2010 Jan 4:9:4.
doi: 10.1186/1475-2875-9-4.

Assessing agreement between malaria slide density readings

Affiliations

Assessing agreement between malaria slide density readings

Neal Alexander et al. Malar J. .

Abstract

Background: Several criteria have been used to assess agreement between replicate slide readings of malaria parasite density. Such criteria may be based on percent difference, or absolute difference, or a combination. Neither the rationale for choosing between these types of criteria, nor that for choosing the magnitude of difference which defines acceptable agreement, are clear. The current paper seeks a procedure which avoids the disadvantages of these current options and whose parameter values are more clearly justified.

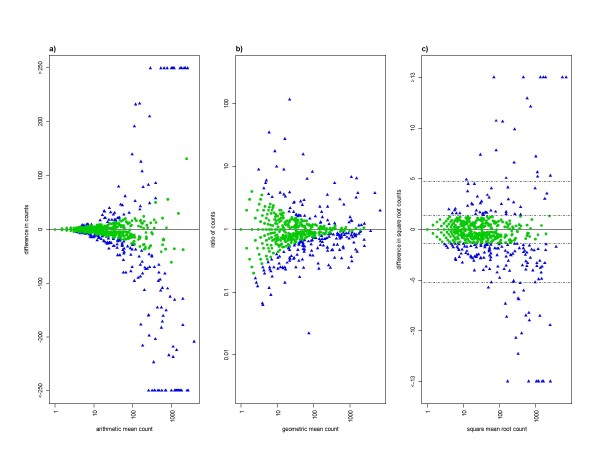
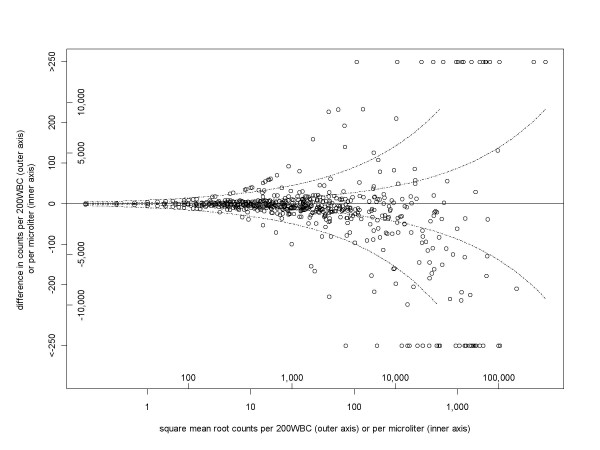
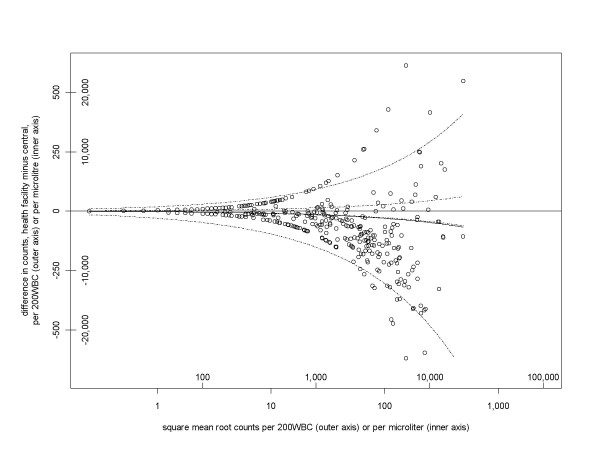
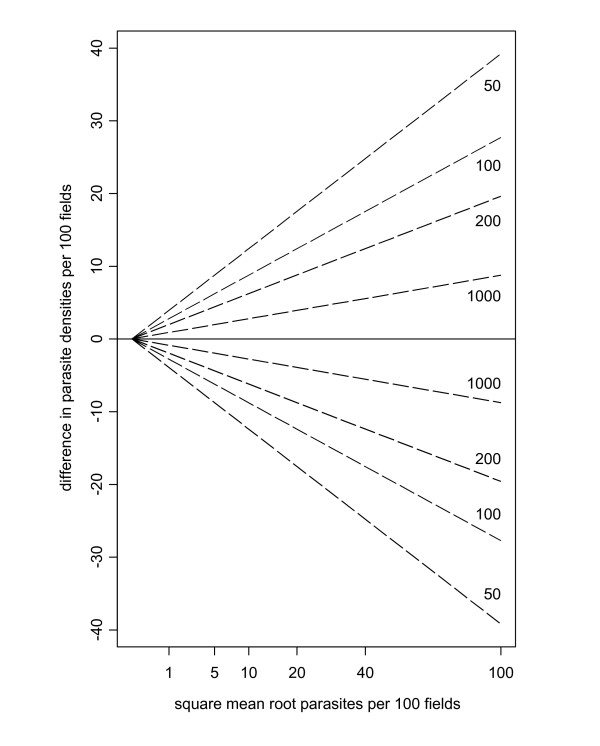
Methods and results: Variation of parasite density within a slide is expected, even when it has been prepared from a homogeneous sample. This places lower limits on sensitivity and observer agreement, quantified by the Poisson distribution. This means that, if a criterion of fixed percent difference criterion is used for satisfactory agreement, the number of discrepant readings is over-estimated at low parasite densities. With a criterion of fixed absolute difference, the same happens at high parasite densities. For an ideal slide, following the Poisson distribution, a criterion based on a constant difference in square root counts would apply for all densities. This can be back-transformed to a difference in absolute counts, which, as expected, gives a wider range of acceptable agreement at higher average densities. In an example dataset from Tanzania, observed differences in square root counts correspond to a 95% limits of agreement of -2,800 and +2,500 parasites/microl at average density of 2,000 parasites/microl, and -6,200 and +5,700 parasites/microl at 10,000 parasites/microl. However, there were more outliers beyond those ranges at higher densities, meaning that actual coverage of these ranges was not a constant 95%, but decreased with density. In a second study, a trial of microscopist training, the corresponding ranges of agreement are wider and asymmetrical: -8,600 to +5,200/microl, and -19,200 to +11,700/microl, respectively. By comparison, the optimal limits of agreement, corresponding to Poisson variation, are +/- 780 and +/- 1,800 parasites/microl, respectively. The focus of this approach on the volume of blood read leads to other conclusions. For example, no matter how large a volume of blood is read, some densities are too low to be reliably detected, which in turn means that disagreements on slide positivity may simply result from within-slide variation, rather than reading errors.

Conclusions: The proposed method defines limits of acceptable agreement in a way which allows for the natural increase in variability with parasite density. This includes defining the levels of between-reader variability, which are consistent with random variation: disagreements within these limits should not trigger additional readings. This approach merits investigation in other settings, in order to determine both the extent of its applicability, and appropriate numerical values for limits of agreement.


Figures

Figure 1
Figure 1
Variation between readers in asexual parasites counts from cross-sectional surveys of malaria in northeastern Tanzania[29]. The vertical axes show between-reader differences in terms of a) absolute difference in counts, b) ratio of counts and c) difference in square root counts. Different types of mean are used on the horizontal axes to ensure that the two axes are uncorrelated: arithmetic mean, geometric mean, and square mean root, respectively. Pairs with a zero reading (n = 702, or 45% of 1564) are not included in panel b) because they give rise to infinite ratios. To increase comparability, they also are omitted from the other two panels. Hence each panel shows 862 paired readings. In panel a), differences in either direction of more than 250 parasites (42 pairs, or 5% of 862) are plotted together at the ends of the vertical axis. This is to stop outliers dominating the figure. This is also done in panel c) for differences in square roots greater than 13 (16 pairs, or 2%). In panel c), the outer pair of horizontal lines shows the 95% range of the difference in square roots: -5.3 to 4.7. The inner pair of horizontal lines shows the range expected under the lower limit on this 95% range from the Poisson distribution: -1.39 to +1.39. In all three panels, the points are green circles or blue triangles, according to whether their difference in square roots is inside or outside this range.
Figure 2
Figure 2
Variation between readers increasing with parasite density: cross-section study[29]. The vertical axis is the between-reader difference in terms of numbers actually counted (outer vertical axis) or in density per microliter (assuming 8,000 white blood cells per microliter, inner vertical axis). This is a back-transformation of Figure 1c, except that pairs with a zero reading are included, giving 1,564 pairs. The 95% range of difference in square roots is -4.9 to +4.5. These values are shown in the outer pair of curved dashed lines, corresponding to horizontal lines in Figure 1c. The inner pair of dashed lines is the lower limit on this 95% range, derived from the Poisson distribution (-1.39 to +1.39). As done for Figure 1c, differences of more than 250 are shown together at the limits of the vertical axis.
Figure 3
Figure 3
Between-reader variation for trial of training methods[30]. The axes are as in Figure 2. The 95% range of difference in square roots for the 528 pairs is -15.2 to +9.2, which transform to the outer pair of curved dashed lines. The inner pair of dashed lines is the lower limit on this 95% range (-1.39 to +1.39), derived from the Poisson distribution.
Figure 4
Figure 4
Limits of agreement are wider when less blood is examined. Ideal limits of agreement in terms of a standard volume of 100 fields. Each pair of dashed lines shows the limits of agreement for differing numbers of fields actually read, with the densities converted to the standard volume. The larger the volume read, the narrower the limits of agreement.

References

    1. Ochola LB, Vounatsou P, Smith T, Mabaso ML, Newton CR. The reliability of diagnostic techniques in the diagnosis and management of malaria in the absence of a gold standard. Lancet Infect Dis. 2006;6:582–588. doi: 10.1016/S1473-3099(06)70579-5. - DOI - PubMed
    1. Wongsrichanalai C, Barcus MJ, Muth S, Sutamihardja A, Wernsdorfer WH. A review of malaria diagnostic tools: microscopy and rapid diagnostic test (RDT) Am J Trop Med Hyg. 2007;77:119–127. - PubMed
    1. Moorthy V, Reed Z, Smith PG. Measurement of malaria vaccine efficacy in phase III trials: report of a WHO consultation. Vaccine. 2007;25:5115–5123. doi: 10.1016/j.vaccine.2007.01.085. - DOI - PubMed
    1. Bates I, Bekoe V, Asamoa-Adu A. Improving the accuracy of malaria-related laboratory tests in Ghana. Malar J. 2004;3:38. doi: 10.1186/1475-2875-3-38. - DOI - PMC - PubMed
    1. Bell D, Wongsrichanalai C, Barnwell JW. Ensuring quality and access for malaria diagnosis: how can it be achieved? Nat Rev Microbiol. 2006;4:682–695. doi: 10.1038/nrmicro1474. - DOI - PubMed

Publication types