. 2010 Jan 4:11:5.
doi: 10.1186/1471-2164-11-5.

Normal colon epithelium: a dataset for the analysis of gene expression and alternative splicing events in colon disease

Affiliations

Normal colon epithelium: a dataset for the analysis of gene expression and alternative splicing events in colon disease

Wilfrido Mojica et al. BMC Genomics. .

Abstract

Background: Studies using microarray analysis of colorectal cancer have been generally beleaguered by the lack of a normal cell population of the same lineage as the tumor cell. One of the main objectives of this study was to generate a reference gene expression data set for normal colonic epithelium which can be used in comparisons with diseased tissues, as well as to provide a dataset that could be used as a baseline for studies in alternative splicing.

Results: We present a dependable expression reference data set for non-neoplastic colonic epithelial cells. An enriched population of fresh colon epithelial cells were obtained from non-neoplastic, colectomy specimens and analyzed using Affymetrix GeneChip EXON 1.0 ST arrays. For demonstration purposes, we have compared the data derived from these cells to a publically available set of tumor and matched normal colon data. This analysis allowed an assessment of global gene expression alterations and demonstrated that adjacent normal tissues, with a high degree of cellular heterogeneity, are not always representative of normal cells for comparison to tumors which arise from the colon epithelium. We also examined alternative splicing events in tumors compared to normal colon epithelial cells.

Conclusions: The findings from this study represent the first comprehensive expression profile for non-neoplastic colonic epithelial cells reported. Our analysis of splice variants illustrate that this is a very labor intensive procedure, requiring vigilant examination of the data. It is projected that the contribution of this set of data derived from pure colonic epithelial cells will enhance studies in colon-related disease and offer a vital baseline for studies aimed at elucidating the mechanisms of alternative splicing.


Figures

Figure 1
Figure 1
Principle Components Analysis and Analysis of Variance of Gene Expression Data: The individual genes are summarized from exon intensities mapping to each locus. The PCA plot shows data from CELLS (red), NORMAL tissues (blue) and tumors (green). It can be seen that the tumor and normal tissues cluster together while the CELLs form a discreet cluster distant from the other samples. (B) Following a 3-way ANOVA the Sources of Variation were plotted. It can be seen that "SCAN DATE" is a major contributer to the variation. This can be attributed to the variation in processing performed by the 2 different laboratories. Also seen as a major source of variation is SEX. This is due to the fact that 7 of the samples in the CELL group were classified as female whereas the TUMOR/NORMAL set of data had 5 of each sex. (C) The SEX and SCAN DATE sources of variation were removed from the ANOVA analysis and the PCA performed. It can be seen that the three sample types cluster more closely but the CELLs still retain a degree of separation. (D) shows the ANOVA -Source of Variation histogram following the removal of the batch effects due to SCAN DATE and SEX. It is now notable that the major source of variation is due primarily to the different TISSUE TYPEs.
Figure 2
Figure 2
Venn Diagram of gene expression alterations for three comparisons. The tumor vs cell comparison showed the largest number of transcript expression changes, while the tumor compared to the adjacent normal tissues showed the lowest number. The 77 genes which show alterations in both the tumor vs cell and tumor vs normal are of interest. All comparisons were performed following RMA normalization of all raw image files. Following a 3-way ANOVA the sources of variation were removed and the comparisons conducted. Cut-off values for gene expression differences were p = 0.05 and combined with a > 2-fold change.
Figure 3
Figure 3
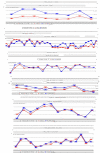
Alternative Splicing Events in genes known to have AS. The grey bars along the top of each diagram represent the RefSeq gene annotation. Traces in the upper region of each figure show average intensities of probesets representing exon regions for tumors (blue) and Cells (red). (a)Shows an example where the alternative splicing index for the GEM gene has a very low p value indicating alternative splicing events, however the fold change values for the entire transcript are ~5 fold suggesting that this is differential expression (b) The tumor tissue is expressing the full length isoform B of the OSBPL1A gene, while the cells are expressing the truncated version, isoform A, which has an alternative 5' start. (c) shows a classic example of a cassette exon, where the tumors are expressing isoform 1 of the PRKCSH gene and = the colon epithelial cells are representing isoform 2. (d) demonstrates another example of a cassette exon in the PYCARD gene. The third exon is not expressed in the tumor (α-isoform) but is expressed in the cells (β-isoform). (e) shows an example 3' alternative splicing in the PHF12 gene and (f) displays an example of a 5'splicing event in the DALRD3 gene.
Figure 4
Figure 4
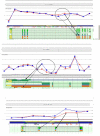
AS events without RefSeq Reports. The grey bars along the top of each diagram represent the RefSeq gene annotation. Traces in the upper region of each figure show average intensities of probesets representing exon regions for tumors (blue) and Cells (red). The lower insets show extensive annotatation provided by the H-InvDB. RefSeq annotation is shown in blue and ENSEMBL in orange (a) RefSeq annotates a single transcript for the FLOT1 gene while the H-InvDB reports annotation for 7 variants shown in the inset. None of the additional transcripts concur with the profile provided by the array. (b) The NES gene shows differential expression of 2 probesets in the 3' exon. RefSeq reports a single variant of this gene, H-InvDB reports 11 variants. The region on the 3' exon that shows higher expression in the tumors corresponds to AS events in the first and last transcripts (shown by arrows) reported by H-InvDB. (c) The C14orf149 gene appear to be differentially spliced between the two tissue types at exons 3,4 and part of 5 of. RefSeq details a single transcript for this gene, while H-Inv reports 4 alternatively spliced variants. None of the reported variants explain the differences between the two tissues profiles obtained from the exon array analysis.
Figure 5
Figure 5
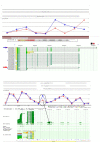
Alternative Splicing Events in Exons Other Than Those Reported in RefSeq. The grey bars along the top of each diagram represent the RefSeq gene annotation. Traces in the upper region of each figure show average intensities of probesets representing exon regions for tumors (blue) and Cells (red). The lower insets show extensive annotatation provided by the H-InvDB. (a) The trace displays the average intensities for the probe sets representing the exons of the CECR5 gene. Expression differences are evident v for exons 4 and 5 and show higher values for the tumor. The 5' exon also shows differences whereby the CELLs express an alternative 5' isoform which has been reported in RefSeq (grey bars). The H-InvDB reports 27 alternative splicing events. The blue arrow highlights the transcript (HIT00075872) the tumor is expressing with exons 3 and 4 retained but the 5' exon is missing. The CELLs appear to be expressing a transcript with AS events at exons 3, 4, 6 and 7 indicated by the red arrow (HIT000279852. (b) The array has a probeset that maps to an intron between exons 9 and 10 in the UBXD5 gene and this region is retained in the tumor samples. The tumor appears to be expressing sequences from the intron between exons 9 and 10. RefSeq annotates 3 representative transcripts, while H-InvDB annotates 15 different transcripts but none of these include retention of this intron. The insert shows a map of the expressed sequenced tag sites ESTs that map to this region on chromosome 1. A collection of these (delineated by the arrow) have been placed in the exact position of the retained intron on UBXD5.
Figure 6
Figure 6
Histology of colonic mucosa. (1a) Section of mucosa was stripped off the colectomy specimen and processed by formalin fixation and paraffin embedding. The mucosa is composed of the lamina propria and epithelium. As is evident, it is not a homogeneous collection of cells, but rather a composite of the cells that are present in the lamina propria (chronic inflammatory cells, smooth muscle cells and vessels) and epithelium (hematoxylin and eosin 10×). (1b) Histologic evidence of enrichment for colonic epithelial cells from the procurement approach described in the text (hematoxylin and eosin 20×).

Similar articles

Cited by

References

    1. Cho KR, Vogelstein B. Suppressor Gene Alterations in the Colorectal Adenoma-Carcinoma Sequence. J Cell Biochem Suppl. 1992;16G:137–41. doi: 10.1002/jcb.240501124. - DOI - PubMed
    1. Notterman DA, Alon U, Sierk AJ, Levine AJ. Transcriptional Gene Expression Profiles of Colorectal Adenoma, Adenocarcinoma, and Normal Tissue Examined by Oligonucleotide Arrays. Cancer Res. 2001;61(7):3124–30. - PubMed
    1. Alon U, Barkai N, Notterman DA, Gish K, Ybarra S, Mack D, Levine AJ. Broad Patterns of Gene Expression Revealed by Clustering Analysis of Tumor and Normal Colon Tissues Probed by Oligonucleotide Arrays. Proc Natl Acad Sci USA. 1999;96(12):6745–50. doi: 10.1073/pnas.96.12.6745. - DOI - PMC - PubMed
    1. Wang ET, Sandberg R, Luo S, Khrebtukova I, Zhang L, Mayr C, Kingsmore SF, Schroth GP, Burge CB. Alternative Isoform Regulation in Human Tissue Transcriptomes. Nature. 2008;456(7221):470–6. doi: 10.1038/nature07509. - DOI - PMC - PubMed
    1. Cuperlovic-Culf M, Belacel N, Culf AS, Ouellette RJ. Data Analysis of Alternative Splicing Microarrays. Drug Discov Today. 2006;11(21-22):983–90. doi: 10.1016/j.drudis.2006.09.011. - DOI - PubMed

Publication types