Comparative Study
. 2010 Feb;133(Pt 2):349-61.
doi: 10.1093/brain/awp309. Epub 2010 Jan 4.

Intra-cerebral injection of neuromyelitis optica immunoglobulin G and human complement produces neuromyelitis optica lesions in mice

Affiliations
Comparative Study

Intra-cerebral injection of neuromyelitis optica immunoglobulin G and human complement produces neuromyelitis optica lesions in mice

Samira Saadoun et al. Brain. 2010 Feb.

Abstract

Neuromyelitis optica is an inflammatory demyelinating disease of the central nervous system associated with autoantibodies against the glial water channel protein aquaporin-4. It has recently been reported that immunoglobulin from neuromyelitis optica patients injected peripherally does not cause lesions in naive rats, but only when pre-existing central nervous system inflammation is present. Here, we investigated whether immunoglobulin G from aquaporin-4-autoantibody-positive neuromyelitis optica patients has the potential to damage the central nervous system either alone or in the presence of human complement. Immunoglobulin G from neuromyelitis optica patients did not activate mouse complement and was not pathogenic when injected into mouse brain. However, co-injection of immunoglobulin G from neuromyelitis optica patients with human complement produced neuromyelitis optica-like lesions in mice. Within 12 h of co-injecting immunoglobulin G from neuromyelitis optica patients and human complement, there was a striking loss of aquaporin-4 expression, glial cell oedema, myelin breakdown and axonal injury, but little intra-parenchymal inflammation. At 7 days, there was extensive inflammatory cell infiltration, perivascular deposition of activated complement components, extensive demyelination, loss of aquaporin-4 expression, loss of reactive astrocytes and neuronal cell death. In behavioural studies, mice injected with immunoglobulin G from neuromyelitis optica patients and human complement into the right hemisphere preferentially turned to the right at 7 days. No brain inflammation, demyelination or right-turning behaviour was seen in wild-type mice that received immunoglobulin G from non-neuromyelitis optica patients with human complement, or in aquaporin-4-null mice that received immunoglobulin G from neuromyelitis optica patients with human complement. We conclude that co-injection of immunoglobulin G from neuromyelitis optica patients with human complement reproduces the key histological features of neuromyelitis optica and that aquaporin-4 is necessary and sufficient for immunoglobulin G from neuromyelitis optica patients to exert its effect. In our mouse model, immunoglobulin G from neuromyelitis optica patients does not require pre-existing central nervous system inflammation to produce lesions.


Figures

Figure 1
Figure 1
Intra-cerebral injections of IgGNMO at Days 0, 3 and 5 do not cause neuromyelitis optica lesions at Day 7. (A) Haematoxylin and eosin stain: coronal brain section through the needle tract. Black rectangle corresponds to section B, red rectangle to C–E and blue rectangle to F. (B) Haematoxylin and eosin stain: capillary 250 µm from needle tract surrounded by normal endothelial, neuronal (blue arrowheads) and glial (green arrowheads) cell nuclei without perivascular inflammation. (C) CD45 immunostain: a few leucocytes (purple arrowheads) were seen around the needle tract. (D) AQP4 immunostain: AQP4 around capillaries (yellow arrowheads) and in brain parenchyma (yellow stars) next to the needle tract. (E) GFAP immunostain: intact astrocytes, including reactive astrocytes (black arrowheads) next to the needle tract. (F) Luxol fast blue stain. Intact white matter tracts (orange arrowheads) next to the needle tract. Bar 2 mm (A), 25 µm (B), 100 µm (C–E), 200 µm (F).
Figure 2
Figure 2
IgGNMO activates human but not mouse complement. (A) CHO cells expressing AQP4 (left column, CHO-AQP4) or AQP1 (right column, CHO-AQP1). Top row: AQP visualized red using anti-AQP4 or anti-AQP1 antibody. Middle row: live cells incubated with IgGNMO followed by Texas Red linked anti-human IgG. Bottom row: live cells incubated with control IgGCON followed by Texas Red linked anti-human IgG. (B) CHO-AQP4 (top) and CHO-AQP1 (bottom) cells were exposed to IgGNMO + hC. At 2 h, dead cells were labelled red and live cells green (left). At 2 h, some cells were immunostained to detect C5b-9 deposition (red, arrowheads) in the plasma cell membrane with 4',6-diamidino-2-phenylindole (blue nuclei) counterstain (right). (C) Plot shows percentage of dead CHO cells [=100 × red/(red + green)] after 2 h incubation. C1inh = C1 inhibitor, hC = human complement, mC = mouse complement. Eight coverslips per condition, mean ± SEM. **P < 0.005 for IgGNMO + hC, CHO-AQP4 compared with each other condition. Bar 50 µm (A), 100 µm (B, left), 25 µm (B, right).
Figure 3
Figure 3
Intra-cerebral injections of IgGNMO with hC at Days 0, 3 and 5 produce extensive inflammation at Day 7. (A–D) Haematoxylin and eosin stain. (A) Coronal brain section shows the needle and the inflamed area (within the white line). (B) Magnified view of area B (from A) shows a vessel ∼200 µm from the needle. Arrowheads indicate inflammatory cells. (C) Magnified view of area C (from A) shows a capillary surrounded by normal endothelium, neuronal (blue arrowheads) and glial (green arrowheads) nuclei without inflammation. (D) Vessel ∼100 µm from the needle with mononuclear (blue arrowheads) and polymorphonuclear (green arrowheads). (E) Neutrophil (Nphil) immunostain and (F) macrophage (Mϕ) immunostain of the CD45+ area in A. (G and H) C9neo immunostain: vasculocentric deposition of C9neo (arrowheads) in rosette (G) and linear (H) pattern. Contra = contralateral (non-injected) hemisphere, Lu = capillary lumen. Bar 2 mm (A), 50 µm (B–C and E–H), 10 µm (D).
Figure 4
Figure 4
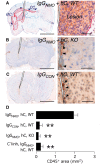
Brain leucocyte infiltration quantified by CD45 immunostain. (A) Wild-type mouse (WT) brain 7 days after injection of IgGNMO + hC. Left: coronal section with the CD45+ area outlined. cc = corpus callosum; ec = external capsule. Right: border (red line) between CD45+ area (Lesion) and surrounding brain. (B) Left: AQP4-null mouse (KO) brain 7 days after injection of IgGNMO + hC. Right: brain next to needle tract. (C) Left: WT brain 7 days after injection of IgGCON + hC. Right: brain next to needle tract. Arrowheads in (B) and (C) indicate leucocytes in the needle tract. (D) CD45+ area (square millimetres) measurements at Day 7 in axial sections 2 mm from the inferior brain surface. Mean ± SEM. n = 7 (IgGNMO, hC, WT), 5 (IgGCON, hC, WT), 5 (IgGNMO, hC, KO), 4 (C1 inhibitor, IgGNMO hC, WT). Haematoxylin counterstain (A–D). **P < 0.005 compared with IgGNMO hC. Bar 2 mm (A–C, Left), 50 µm (A–C, Right).
Figure 5
Figure 5
Intra-cerebral injection of IgGNMO + hC at Days 0, 3 and 5 causes demyelination at Day 7. (A–C) Coronal and (D) axial brain sections stained with Luxol fast blue. (A) Wild-type (WT) mouse injected with IgGNMO + hC. Green arrowheads indicate demyelinated external capsule and green line demarcates demyelinated tracts in the injected hemisphere. Red arrowheads show normally myelinated external capsule and red line demarcates normally myelinated tracts in the non-injected side. (B) AQP4-null mouse (KO) brain injected with IgGNMO + hC. (C) WT brain injected with IgGCON + hC. (D) Section at 2.0 mm from the inferior brain surface. a = length of demyelinated external capsule in injected hemisphere; b = length of myelinated external capsule in non-injected hemisphere. (E) Summary of demyelination (a/b) data. Mean ± SEM. n = 7 (IgGNMO + hC, WT), 5 (IgGCON + hC, WT), 5 (IgGNMO + hC, KO), 4 (IgGNMO + hC + C1 inhibitor, WT). **P < 0.005 compared with IgGNMO + hC, WT. Bar 2 mm (A–D).
Figure 6
Figure 6
Intra-cerebral injection of IgGNMO + hC at Days 0, 3, and 5 causes loss of GFAP and AQP4 expression at Day 7. (A–D) Wild-type (WT) brain 7 days after injection of IgGNMO + hC. (A) GFAP and (B) AQP4 immunostain of lesion and perilesional area. (A) and (B) are sequential sections. Blue and green arrowheads mark corresponding vessels. Black arrowheads indicate fragmented GFAP+ processes within the lesion. Inset: reactive astrocyte. (C) GFAP and (D) AQP4 immunostain of contralateral (non-injected) hemisphere. Arrowheads indicate microvessels. (E) AQP4-null mouse (KO) brain injected with IgGNMO + hC immunostained for (left) GFAP and (right) AQP4. (F) WT mouse brain injected with IgGCON + hC immunostained for (left) GFAP and (right) AQP4. Bar 100 µm (A and B), 50 µm (C–F), 20 µm (A, Inset).
Figure 7
Figure 7
Quantification of AQP4 and GFAP immunoreactivities 7 days after intra-cerebral injection of IgGNMO + hC or IgGCON + hC. (A) AQP4 expression: 0 = nil; += perivascular; ++ = parenchymal. GFAP expression: 0 = nil; + = perivascular and/or occasional reactive astrocyte; ++ = high density of reactive astrocytes. (B) Summary of AQP4 and GFAP immunoreactivities in and around lesions of WT mice injected with IgGNMO + hC, and next to the needle tracts of AQP4-null (KO) mice injected with IgGNMO + hC or WT mice injected with IgGCON + hC. Bar 100 µm (all panels).
Figure 8
Figure 8
Injection of IgGNMO + hC into the right hemisphere at Days 0, 3 and 5 causes right-turning behaviour at Day 7. (A) Y-shaped tunnel for quantifying mouse turning behaviour. The mouse was placed at the Y-shaped intersection 20 times. Each time we noted whether the mouse turned right or left. (B) Summary of behavioural data (percentage of right turns). n = 7 (IgGNMO + hC, WT), 6 (IgGCON + hC, WT), 7 (IgGNMO + hC, KO), 4 (IgGNMO + hC + C1 inhibitor, WT). *P < 0.05, **P < 0.005 compared with IgGNMO + hC WT. Gray line indicates percentage of right turns in uninjected WT and AQP4-null mice.
Figure 9
Figure 9
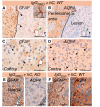
Intra-ventricular injection of IgGNMO + hC at Days 0, 3 and 5 causes ependymal destruction at Day 7. Sections of brain after intra-ventricular injection of (A) IgGNMO + hC into WT mouse, (B) IgGCON + hC into WT mouse and (C) IgGNMO + hC into AQP4-null (KO) mouse. Top panel: AQP4 immunostain of the border between cerebrospinal fluid (CSF) and brain parenchyma (Brain). Blue arrowheads in (B) and (C) indicate intact ependyma. In (A) the ependyma is replaced by inflammatory cell infiltrate (Inflam.). White line marks the border between inflammation and brain. Middle pictures: CD45 immunostain. Bottom panel: GFAP immunostain. Red arrowheads in (A) show reactive astrocyte processes within the inflamed region. Bar 50 µm (A–C).
Figure 10
Figure 10
Intra-cerebral injection of IgGNMO + hC causes loss of AQP4 expression and myelin breakdown within 12 h. Wildtype mouse brain 12 h after injection of IgGNMO + hC. (A) AQP4 immunostain, (B) Luxol fast blue stain and (C) CD45 immunostain. Non-stained area in (A) and (B) is outlined. Inset in (A) shows border between AQP4-immunopositive and -immunonegative area and arrowheads indicate capillaries. (D–F). Haematoxylin and eosin stain of brain 0.5 mm from injection site. (D) Arrowheads mark swollen glia. Circled area shows neutrophils within microvessel lumen. (E) Magnified view of circled area in (D). Arrowheads indicate neutrophils. Inset: CD45 immunostain. (F) Magnified view of swollen glia 0.5 mm from the injection site. Bar 2 mm (A–C), 50 µm (D), 20 µm (E, E Inset, F).
Figure 11
Figure 11
Intra-cerebral injection of IgGNMO + hC causes axonal injury within 12 h and neuronal cell death within 7 days. (A) Schematic showing needle and areas examined for FJ-C stain (green rectangles) and βAPP immunostain (black rectangles). (B–E) Representative areas stained with FJ-C (left) or immunostained with βAPP (right). Yellow arrowheads indicate FJ-C-positive cells, blue arrowheads show βAPP immunopositivity, dashed black lines demarcate degenerating white matter tracts and continuous black lines demarcate intact white matter tracts. (F) Data summary of FJ-C-positive cells/high power field at Day 7. Mean ± SEM. N = 6 (IgGNMO, hC, WT), 5 (IgGCON, hC, WT), 5 (IgGNMO, hC, KO); four high-power fields per mouse. Bar 50 µm (B–E, left), 100 µm (B–E, right). **P < 0.005 compared with IgGCON, hC, WT and with IgGNMO, hC, KO.

References

    1. Bennett JL, Lam C, Kalluri SR, Saikali P, Bautista K, Dupree C, et al. Intrathecal pathogenic anti-aquaporin-4 antibodies in early neuromyelitis optica. Ann Neurol. 2009 in press. - PMC - PubMed
    1. Bradl M, Misu T, Takahashi T, Watanabe M, Mader S, Reindl M, et al. Neuromyelitis optica: pathogenicity of patient immunoglobulin in vivo. Ann Neurol. 2009 in press. - PubMed
    1. Hinson SR, Pittock SJ, Lucchinetti CF, Roemer SF, Fryer JP, Kryzer TJ, et al. Pathogenic potential of IgG binding to water channel extracellular domain in neuromyelitis optica. Neurology. 2007;69:2221–31. - PubMed
    1. Ito S, Mori M, Makino T, Hayakawa S, Kuwabara S. ‘Cloud-like enhancement’ is a magnetic resonance imaging abnormality specific to neuromyelitis optica. Ann Neurol. 2009;66:425–8. - PubMed
    1. Jarius S, Aboul-Enein F, Waters P, Kuenz B, Hauser A, Berger T, et al. Antibody to aquaporin-4 in the long-term course of neuromyelitis optica. Brain. 2008a;131:3072–80. - PMC - PubMed

Publication types