

Determination of the in vivo structural DNA loop organization in the genomic region of the rat albumin locus by means of a topological approach
- PMID: 20047947
- PMCID: PMC2818189
- DOI: 10.1093/dnares/dsp027
Determination of the in vivo structural DNA loop organization in the genomic region of the rat albumin locus by means of a topological approach
Abstract
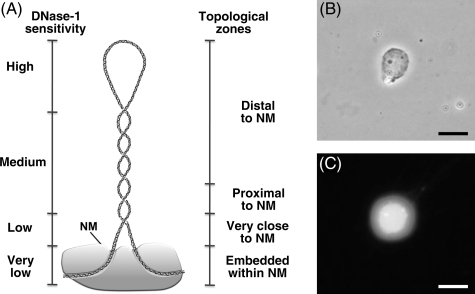
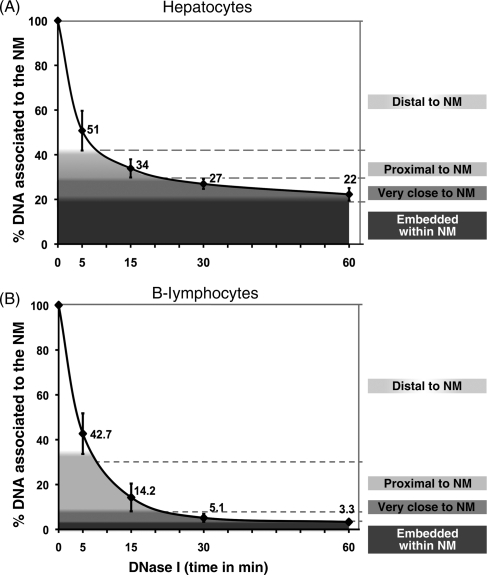
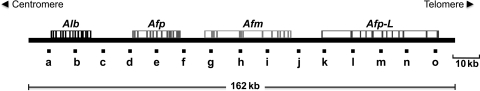
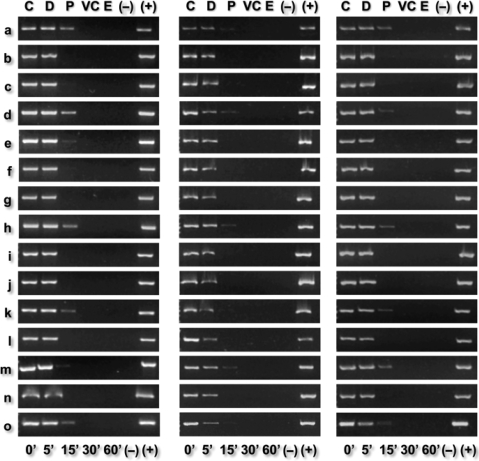
Nuclear DNA of metazoans is organized in supercoiled loops anchored to a proteinaceous substructure known as the nuclear matrix (NM). DNA is anchored to the NM by non-coding sequences known as matrix attachment regions (MARs). There are no consensus sequences for identification of MARs and not all potential MARs are actually bound to the NM constituting loop attachment regions (LARs). Fundamental processes of nuclear physiology occur at macromolecular complexes organized on the NM; thus, the topological organization of DNA loops must be important. Here, we describe a general method for determining the structural DNA loop organization in any large genomic region with a known sequence. The method exploits the topological properties of loop DNA attached to the NM and elementary topological principles such as that points in a deformable string (DNA) can be positionally mapped relative to a position-reference invariant (NM), and from such mapping, the configuration of the string in third dimension can be deduced. Therefore, it is possible to determine the specific DNA loop configuration without previous characterization of the LARs involved. We determined in hepatocytes and B-lymphocytes of the rat the DNA loop organization of a genomic region that contains four members of the albumin gene family.
Figures


Similar articles
-
Cell-type-specific organization of nuclear DNA into structural looped domains.J Cell Biochem. 2011 Feb;112(2):531-40. doi: 10.1002/jcb.22943. J Cell Biochem. 2011. PMID: 21268074
-
DNA Length Modulates the Affinity of Fragments of Genomic DNA for the Nuclear Matrix In Vitro.J Cell Biochem. 2017 Dec;118(12):4487-4497. doi: 10.1002/jcb.26106. Epub 2017 May 31. J Cell Biochem. 2017. PMID: 28464286
-
The organization of a large transcriptional unit (Fyn) into structural DNA loops is cell-type specific and independent of transcription.Gene. 2012 Feb 1;493(1):1-8. doi: 10.1016/j.gene.2011.11.050. Epub 2011 Dec 3. Gene. 2012. PMID: 22155708
-
Scaffold/Matrix Attachment Regions and intrinsic DNA curvature.Biochemistry (Mosc). 2006 May;71(5):481-8. doi: 10.1134/s0006297906050038. Biochemistry (Mosc). 2006. PMID: 16732725 Review.
-
DNA loops: structural and functional properties of scaffold-attached regions.Mol Microbiol. 1992 Feb;6(4):419-23. doi: 10.1111/j.1365-2958.1992.tb01485.x. Mol Microbiol. 1992. PMID: 1560771 Review.
Cited by
-
DNA moves sequentially towards the nuclear matrix during DNA replication in vivo.BMC Cell Biol. 2011 Jan 19;12:3. doi: 10.1186/1471-2121-12-3. BMC Cell Biol. 2011. PMID: 21244708 Free PMC article.
-
Continued stabilization of the nuclear higher-order structure of post-mitotic neurons in vivo.PLoS One. 2011;6(6):e21360. doi: 10.1371/journal.pone.0021360. Epub 2011 Jun 23. PLoS One. 2011. PMID: 21731716 Free PMC article.
-
The post-mitotic state in neurons correlates with a stable nuclear higher-order structure.Commun Integr Biol. 2012 Mar 1;5(2):134-9. doi: 10.4161/cib.18761. Commun Integr Biol. 2012. PMID: 22808316 Free PMC article.
References
-
- Nickerson J.A. Experimental observations of a nuclear matrix. J. Cell Sci. 2001;114:463–74. - PubMed
-
- Tsutsui K.M., Sano K., Tsutsui K. Dynamic view of the nuclear matrix. Acta Med. Okayama. 2005;59:113–20. - PubMed
-
- Razin S.V. The nuclear matrix and chromosomal DNA loops: is there any correlation between partitioning of the genome into loops and functional domains? Cell Mol. Biol. Lett. 2001;6:59–69. - PubMed
Publication types
MeSH terms
Substances
LinkOut - more resources
Full Text Sources
Miscellaneous
