Electrostatic hot spot on DNA-binding domains mediates phosphate desolvation and the pre-organization of specificity determinant side chains
- PMID: 20047959
- PMCID: PMC2853105
- DOI: 10.1093/nar/gkp1132
Electrostatic hot spot on DNA-binding domains mediates phosphate desolvation and the pre-organization of specificity determinant side chains
Abstract
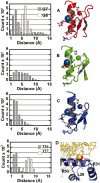
A major obstacle towards elucidating the molecular basis of transcriptional regulation is the lack of a detailed understanding of the interplay between non-specific and specific protein-DNA interactions. Based on molecular dynamics simulations of C(2)H(2) zinc fingers (ZFs) and engrailed homeodomain transcription factors (TFs), we show that each of the studied DNA-binding domains has a set of highly constrained side chains in preset configurations ready to form hydrogen bonds with the DNA backbone. Interestingly, those domains that bury their recognition helix into the major groove are found to have an electrostatic hot spot for Cl(-) ions located on the same binding cavity as the most buried DNA phosphate. The spot is characterized by three protein hydrogen bond donors, often including two basic side chains. If bound, Cl(-) ions, likely mimicking phosphates, steer side chains that end up forming specific contacts with bases into bound-like conformations. These findings are consistent with a multi-step DNA-binding mechanism in which a pre-organized set of TF side chains assist in the desolvation of phosphates into well defined sites, prompting the re-organization of specificity determining side chains into conformations suitable for the recognition of their cognate sequence.
Figures


Similar articles
-
Molecular dynamics analysis of the engrailed homeodomain-DNA recognition.J Struct Biol. 2006 Sep;155(3):426-37. doi: 10.1016/j.jsb.2006.03.031. Epub 2006 May 7. J Struct Biol. 2006. PMID: 16765059
-
Solution structure of the first three zinc fingers of TFIIIA bound to the cognate DNA sequence: determinants of affinity and sequence specificity.J Mol Biol. 1997 Oct 17;273(1):183-206. doi: 10.1006/jmbi.1997.1291. J Mol Biol. 1997. PMID: 9367756
-
Binding regularities in complexes of transcription factors with operator DNA: homeodomain family.J Biomol Struct Dyn. 2009 Jun;26(6):687-700. doi: 10.1080/07391102.2009.10507282. J Biomol Struct Dyn. 2009. PMID: 19385698
-
A framework for the DNA-protein recognition code of the probe helix in transcription factors: the chemical and stereochemical rules.Structure. 1994 Apr 15;2(4):317-26. doi: 10.1016/s0969-2126(00)00033-2. Structure. 1994. PMID: 8087558 Review.
-
Cations as hydrogen bond donors: a view of electrostatic interactions in DNA.Annu Rev Biophys Biomol Struct. 2003;32:27-45. doi: 10.1146/annurev.biophys.32.110601.141726. Epub 2003 Feb 14. Annu Rev Biophys Biomol Struct. 2003. PMID: 12598364 Review.
Cited by
-
Genetic and structural study of DNA-directed RNA polymerase II of Trypanosoma brucei, towards the designing of novel antiparasitic agents.PeerJ. 2017 Mar 1;5:e3061. doi: 10.7717/peerj.3061. eCollection 2017. PeerJ. 2017. PMID: 28265521 Free PMC article.
-
Investigating dynamic and energetic determinants of protein nucleic acid recognition: analysis of the zinc finger zif268-DNA complexes.BMC Struct Biol. 2010 Nov 24;10:42. doi: 10.1186/1472-6807-10-42. BMC Struct Biol. 2010. PMID: 21106075 Free PMC article.
-
Dynamics and recognition within a protein-DNA complex: a molecular dynamics study of the SKN-1/DNA interaction.Nucleic Acids Res. 2016 Feb 18;44(3):1440-8. doi: 10.1093/nar/gkv1511. Epub 2015 Dec 31. Nucleic Acids Res. 2016. PMID: 26721385 Free PMC article.
References
-
- Berg OG, Winter RB, von Hippel PH. Diffusion-driven mechanisms of protein translocation on nucleic acids. 1. Models and theory. Biochemistry. 1981;20:6929–6948. - PubMed
-
- Pabo CO, Sauer RT. Protein-DNA Recognition. Ann. Rev. Biochem. 1984;53:293–321. - PubMed
-
- Anderson CF, Record M.T., Jr Salt-nucleic acid interactions. Annu. Rev. Phys. Chem. 1995;46:657–700. - PubMed
Publication types
MeSH terms
Substances
LinkOut - more resources
Full Text Sources
Miscellaneous

