Differential coregulator requirements for function of the hematopoietic transcription factor GATA-1 at endogenous loci
- PMID: 20047963
- PMCID: PMC2853107
- DOI: 10.1093/nar/gkp1159
Differential coregulator requirements for function of the hematopoietic transcription factor GATA-1 at endogenous loci
Abstract
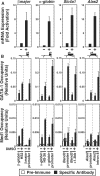
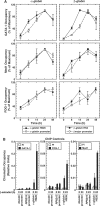
The critical regulator of hematopoiesis GATA-1 recruits diverse coregulators to chromatin, which mediate transcriptional activation and repression. These coregulators include the cell-type-specific multi-zinc finger protein Friend of GATA-1 (FOG-1), the histone acetyltransferase CREB binding protein (CBP), and the key component of the Mediator complex Med1. While FOG-1 is an established GATA-1 coregulator, the importance of interactions between GATA-1 and other coregulators is poorly understood. Furthermore, whether GATA-1 utilizes multiple coregulators at all loci, or if certain coregulators are dedicated to specific loci is unknown. We compared the capacity of GATA-1 to recruit and utilize FOG-1 and Med1 at activated and repressed target genes. Similar to FOG-1, GATA-1 recruited Med1 to activated genes, and the kinetics of FOG-1 and Med1 recruitment were similar. GATA-1 recruited Med1 in Fog1(-/-) cells, indicating that GATA-1-mediated Med1 recruitment is FOG-1-independent. In contrast to FOG-1, GATA-1 evicted Med1 during transcriptional repression. Whereas knocking-down FOG-1 had catastrophic effects on GATA-1-mediated activation and repression, knocking-down Med1 modestly impaired GATA-1 activity only at select loci. These results illustrate both similarities and differences between GATA-1-mediated recruitment of FOG-1 and Med1 to chromatin, with a fundamental difference being the quantitatively greater requirement for FOG-1.
Figures


Similar articles
-
Establishment of a cell-type-specific genetic network by the mediator complex component Med1.Mol Cell Biol. 2013 May;33(10):1938-55. doi: 10.1128/MCB.00141-13. Epub 2013 Mar 4. Mol Cell Biol. 2013. PMID: 23459945 Free PMC article.
-
Establishing a hematopoietic genetic network through locus-specific integration of chromatin regulators.Proc Natl Acad Sci U S A. 2013 Sep 3;110(36):E3398-407. doi: 10.1073/pnas.1302771110. Epub 2013 Aug 19. Proc Natl Acad Sci U S A. 2013. PMID: 23959865 Free PMC article.
-
Controlling hematopoiesis through sumoylation-dependent regulation of a GATA factor.Mol Cell. 2009 Dec 25;36(6):984-95. doi: 10.1016/j.molcel.2009.11.005. Mol Cell. 2009. PMID: 20064464 Free PMC article.
-
Navigating Transcriptional Coregulator Ensembles to Establish Genetic Networks: A GATA Factor Perspective.Curr Top Dev Biol. 2016;118:205-44. doi: 10.1016/bs.ctdb.2016.01.003. Epub 2016 Feb 23. Curr Top Dev Biol. 2016. PMID: 27137658 Review.
-
Coregulation of GATA factors by the Friend of GATA (FOG) family of multitype zinc finger proteins.Semin Cell Dev Biol. 2005 Feb;16(1):117-28. doi: 10.1016/j.semcdb.2004.10.006. Epub 2004 Dec 15. Semin Cell Dev Biol. 2005. PMID: 15659346 Review.
Cited by
-
Relocalizing genetic loci into specific subnuclear neighborhoods.J Biol Chem. 2011 May 27;286(21):18834-44. doi: 10.1074/jbc.M111.221481. Epub 2011 Mar 11. J Biol Chem. 2011. PMID: 21398517 Free PMC article.
-
Dissecting the function of the adult β-globin downstream promoter region using an artificial zinc finger DNA-binding domain.Nucleic Acids Res. 2014 Apr;42(7):4363-74. doi: 10.1093/nar/gku107. Epub 2014 Feb 4. Nucleic Acids Res. 2014. PMID: 24497190 Free PMC article.
-
Drosophila Mediator Subunit Med1 Is Required for GATA-Dependent Developmental Processes: Divergent Binding Interfaces for Conserved Coactivator Functions.Mol Cell Biol. 2019 Mar 19;39(7):e00477-18. doi: 10.1128/MCB.00477-18. Print 2019 Apr 1. Mol Cell Biol. 2019. PMID: 30670567 Free PMC article.
-
Specific erythroid-lineage defect in mice conditionally deficient for Mediator subunit Med1.Proc Natl Acad Sci U S A. 2010 Dec 14;107(50):21541-6. doi: 10.1073/pnas.1005794107. Epub 2010 Nov 23. Proc Natl Acad Sci U S A. 2010. PMID: 21098667 Free PMC article.
-
Epigenetic and genetic mechanisms in red cell biology.Curr Opin Hematol. 2014 May;21(3):155-64. doi: 10.1097/MOH.0000000000000034. Curr Opin Hematol. 2014. PMID: 24722192 Free PMC article. Review.
References
-
- Kim SI, Bresnick EH. Transcriptional control of erythropoiesis: emerging mechanisms and principles. Oncogene. 2007;26:6777–6794. - PubMed
-
- Evans T, Felsenfeld G. The erythroid-specific transcription factor Eryf1: a new finger protein. Cell. 1989;58:877–885. - PubMed
-
- Tsai SF, Martin DI, Zon LI, D'A;ndrea AD, Wong GG, Orkin SH. Cloning of cDNA for the major DNA-binding protein of the erythroid lineage through expression in mammalian cells. Nature. 1989;339:446–451. - PubMed
-
- Yamamoto M, Ko LJ, Leonard MW, Beug H, Orkin SH, Engel JD. Activity and tissue-specific expression of the transcription factor NF- E1 multigene family. Genes Dev. 1990;4:1650–1662. - PubMed
Publication types
MeSH terms
Substances
Grants and funding
LinkOut - more resources
Full Text Sources
Molecular Biology Databases

