

A comparison of sample size and power in case-only association studies of gene-environment interaction
- PMID: 20047976
- PMCID: PMC2816730
- DOI: 10.1093/aje/kwp398
A comparison of sample size and power in case-only association studies of gene-environment interaction
Abstract
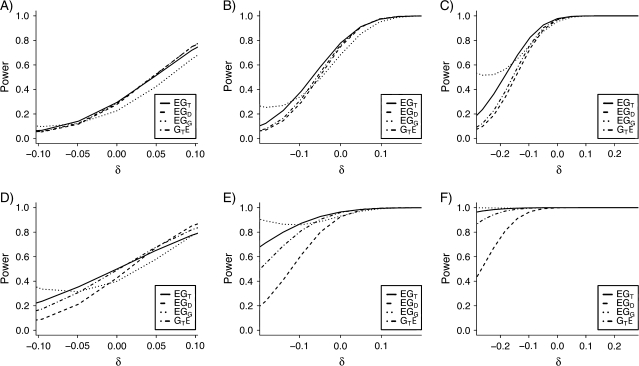
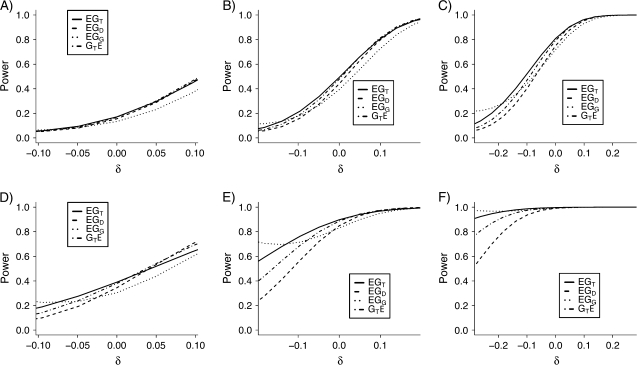
Assuming continuous, normally distributed environmental and categorical genotype variables, the authors compare 6 case-only designs for tests of association in gene-environment interaction. Novel tests modeling the environmental variable as either the response or the predictor and allowing a genetic variable with multiallelic variants are included. The authors show that tests imposing the same genotypic pattern of inheritance perform similarly regardless of whether genotype is the response variable or the predictor variable. The novel tests using the genetic variable as the response variable are advantageous because they are robust to non-normally distributed environmental exposures. Dominance deviance-deviation from additivity in the main or interaction effects-is key to test performance: When it is zero or modest, tests searching for a trend with increasing risk alleles are optimal; when it is large, tests for genotypic effects are optimal. However, the authors show that dominance deviance is attenuated when it is observed at a proxy locus, which is common in genome-wide association studies, so large dominance deviance is likely to be rare. The authors conclude that the trend test is the appropriate tool for large-scale association scans where the true gene-environment interaction model is unknown. The common practice of assuming a dominant pattern of inheritance can cause serious losses of power in the presence of any recessive, or modest dominant, effects.
Figures
Comment in
-
On the interpretation, robustness, and power of varieties of case-only tests of gene-environment interaction.Am J Epidemiol. 2010 Dec 15;172(12):1335-8. doi: 10.1093/aje/kwq359. Epub 2010 Nov 23. Am J Epidemiol. 2010. PMID: 21098632 Free PMC article.
Similar articles
-
Genome screens using linkage disequilibrium tests: optimal marker characteristics and feasibility.Am J Hum Genet. 1998 Dec;63(6):1872-85. doi: 10.1086/302139. Am J Hum Genet. 1998. PMID: 9837839 Free PMC article.
-
Power comparison of Cochran-Armitage trend test against allelic and genotypic tests in large-scale case-control genetic association studies.Stat Methods Med Res. 2018 Sep;27(9):2657-2673. doi: 10.1177/0962280216683979. Epub 2016 Dec 23. Stat Methods Med Res. 2018. PMID: 28008794
-
Likelihoods and TDT for the case-parents design.Genet Epidemiol. 1999;16(3):250-60. doi: 10.1002/(SICI)1098-2272(1999)16:3<250::AID-GEPI2>3.0.CO;2-T. Genet Epidemiol. 1999. PMID: 10096688
-
Subgroup analyses in randomised controlled trials: quantifying the risks of false-positives and false-negatives.Health Technol Assess. 2001;5(33):1-56. doi: 10.3310/hta5330. Health Technol Assess. 2001. PMID: 11701102 Review.
-
Combining the case-control methodology with the small size transmission/disequilibrium test for multiallelic markers.Eur J Hum Genet. 2005 Sep;13(9):1007-12. doi: 10.1038/sj.ejhg.5201453. Eur J Hum Genet. 2005. PMID: 15957000 Review.
Cited by
-
Genome-wide investigation of exogenous female hormones, genetic variation, and venous thromboembolism risk.J Thromb Haemost. 2024 Aug;22(8):2261-2269. doi: 10.1016/j.jtha.2024.05.011. Epub 2024 May 21. J Thromb Haemost. 2024. PMID: 38782299 Free PMC article.
-
Use of Spontaneous Reporting Systems to Detect Host-Medication Interactions: Sex Differences in Oral Anti-Diabetic Drug-Associated Myocardial Infarction.J Am Heart Assoc. 2018 Nov 20;7(22):e008959. doi: 10.1161/JAHA.118.008959. J Am Heart Assoc. 2018. PMID: 30571494 Free PMC article.
-
Association between birth by caesarian section and anxiety, self-harm: a gene-environment interaction study using UK Biobank data.BMC Psychiatry. 2023 Apr 7;23(1):237. doi: 10.1186/s12888-023-04720-0. BMC Psychiatry. 2023. PMID: 37029353 Free PMC article.
-
Novel genetic associations for blood pressure identified via gene-alcohol interaction in up to 570K individuals across multiple ancestries.PLoS One. 2018 Jun 18;13(6):e0198166. doi: 10.1371/journal.pone.0198166. eCollection 2018. PLoS One. 2018. PMID: 29912962 Free PMC article.
-
Gene-environment interactions in severe mental illness.Front Psychiatry. 2014 May 15;5:48. doi: 10.3389/fpsyt.2014.00048. eCollection 2014. Front Psychiatry. 2014. PMID: 24860514 Free PMC article. Review.
References
-
- Khoury MJ, Flanders WD. Nontraditional epidemiologic approaches in the analysis of gene-environment interaction: case-control studies with no controls! Am J Epidemiol. 1996;144(3):207–213. - PubMed
-
- Piegorsch WW, Weinberg CR, Taylor JA. Non-hierarchical logistic models and case-only designs for assessing susceptibility in population-based case-control studies. Stat Med. 1994;13(2):153–162. - PubMed
-
- Begg CB, Zhang ZF. Statistical analysis of molecular epidemiology studies employing case-series. Cancer Epidemiol Biomarkers Prev. 1994;3(2):173–175. - PubMed
-
- Umbach DM, Weinberg CR. Designing and analysing case-control studies to exploit independence of genotype and exposure. Stat Med. 1997;16(15):1731–1743. - PubMed
-
- Yang Q, Khoury MJ, Flanders WD. Sample size requirements in case-only designs to detect gene-environment interaction. Am J Epidemiol. 1997;146(9):713–720. - PubMed
