. 2010 Mar;184(3):839-52.
doi: 10.1534/genetics.109.113183. Epub 2010 Jan 4.

Bayesian quantitative trait locus mapping using inferred haplotypes

Affiliations

Bayesian quantitative trait locus mapping using inferred haplotypes

Caroline Durrant et al. Genetics. 2010 Mar.

Abstract

We describe a fast hierarchical Bayesian method for mapping quantitative trait loci by haplotype-based association, applicable when haplotypes are not observed directly but are inferred from multiple marker genotypes. The method avoids the use of a Monte Carlo Markov chain by employing priors for which the likelihood factorizes completely. It is parameterized by a single hyperparameter, the fraction of variance explained by the quantitative trait locus, compared to the frequentist fixed-effects model, which requires a parameter for the phenotypic effect of each combination of haplotypes; nevertheless it still provides estimates of haplotype effects. We use simulation to show that the method matches the power of the frequentist regression model and, when the haplotypes are inferred, exceeds it for small QTL effect sizes. The Bayesian estimates of the haplotype effects are more accurate than the frequentist estimates, for both known and inferred haplotypes, which indicates that this advantage is independent of the effect of uncertainty in haplotype inference and will hold in comparison with frequentist methods in general. We apply the method to data from a panel of recombinant inbred lines of Arabidopsis thaliana, descended from 19 inbred founders.


Figures

F<sc>igure</sc> 1.—
Figure 1.—
Power to detect a QTL when haplotypes are known, as a function of the QTL effect size as a percentage of the total phenotypic variance. Results are presented for a range of QTL allele frequencies, f = the number of founder accessions out of 19, for the nominal 5% (A–D) and genomewide 0.08% (E–H) significance thresholds. The statistics are mode(κ) (red) and logP (blue).
F<sc>igure</sc> 2.—
Figure 2.—
MSE of estimates of individual haplotype pair effects. (A) Comparison of histograms of MSEQTL for regression (blue) and Bayesian (red) estimates, with (B) comparison of MSEQTL between methods for each simulated data set. Data are for a 5% QTL carried on 4 of 19 haplotype pairs.
F<sc>igure</sc> 3.—
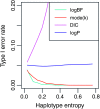
Figure 3.—
Type I error rates when haplotypes are inferred, as a function of the sample-average entropy at a locus for the 5% significance threshold. Locus error rates were calculated from 1000 simulated data sets at each locus. The statistics are mode(κ) (red), logBF (light blue), DICdiff (pink), and logP (dark blue).
F<sc>igure</sc> 4.—
Figure 4.—
Effect of haplotype uncertainty on individual effect estimates, from the regression and Bayesian analyses in relation to the simulated values for the QTL model (MSEQTL) and the null model (MSEnull). (A) MSEQTL of regression estimates; (B) MSEnull of regression estimates; (C) MSEQTL of Bayesian estimates; (D) MSEnull of Bayesian estimates. (Note log scale of y-axes for the regression MSEs.) The box (or box-and-whisker) plots show the spread of the distribution of points generated by the simulation for the different entropy levels. The box shows the central 50% of the distribution, between the 25 and 75% quartiles, with the middle bar representing the median or 50% quartile. The whiskers extend to the farthest data point that is no more than 1.5 times the length of the box away from the box. Data points farther away are plotted individually.
F<sc>igure</sc> 5.—
Figure 5.—
Power to detect a QTL for inferred haplotypes for constant and adjusted thresholds, as a function of the sample-average entropy at a locus. Results are presented for a range of QTL effect sizes as a percentage of the total phenotypic variance, for the nominal 5% (A–E) and genomewide 0.08% (F–J) significance levels. Power is reported for the statistics mode(κ) and logP for both constant thresholds [red, mode(κ); blue, logP] and adjusted thresholds [pink, mode(κ); light blue, logP].
F<sc>igure</sc> 6.—
Figure 6.—
Real data analysis of the phenotype, days to germination. Horizontal lines represent significance thresholds calculated via simulation: nominal 5% (dashed line) and genomewide 0.08% (solid line). Vertical lines represent the boundaries between chromosomes.
F<sc>igure</sc> 7.—
Figure 7.—
Real data analysis of the phenotype, days to bolting time. Horizontal lines represent significance thresholds calculated via simulation: nominal 5% (dashed line) and genomewide 0.08% (solid line). Vertical lines represent the boundaries between chromosomes.

Similar articles

Cited by

References

    1. Bardel, C., P. Darlu and E. Genin, 2006. Clustering of haplotypes based on phylogeny: How good a strategy for association testing? Eur. J. Hum. Genet. 14 202–206. - PubMed
    1. Durrant, C., K. T. Zondervan, L. R. Cardon, S. Hunt, P. Deloukas et al., 2004. Linkage disequilibrium mapping via cladistic analysis of single-nucleotide polymorphism haplotypes. Am. J. Hum. Genet. 75 35–43. - PMC - PubMed
    1. Excoffier, L., and M. Slatkin, 1995. Maximum-likelihood estimation of molecular haplotype frequencies in a diploid population. Mol. Biol. Evol. 12(5): 921–927. - PubMed
    1. Gelman, A., J. B. Carlin, H. S. Stern and D. B. Rubin, 2004. Bayesian Data Analysis, Ed. 2 (Texts in Statistical Science). Chapman & Hall/CRC, London/New York/Washington, D.C./Boca Raton, FL.
    1. Haley, C. S., and S. A. Knott, 1992. A simple regression method for mapping quantitative trait loci in line crosses using flanking markers. Heredity 69 315–324. - PubMed