. 2010 Feb 1;184(3):1218-26.
doi: 10.4049/jimmunol.0902620. Epub 2010 Jan 4.

Commensal microbiota and CD8+ T cells shape the formation of invariant NKT cells

Affiliations

Commensal microbiota and CD8+ T cells shape the formation of invariant NKT cells

Bo Wei et al. J Immunol. .

Abstract

Commensal bacteria play an important role in formation of the immune system, but the mechanisms involved are incompletely understood. In this study, we analyze CD1d-restricted invariant NKT (iNKT) cells in germfree mice and in two colonies of C57BL/6 mice termed conventional flora and restricted flora (RF), stably bearing commensal microbial communities of diverse but distinct composition. In germfree mice, iNKT cells were moderately reduced, suggesting that commensal microbiota were partially required for the antigenic drive in maintaining systemic iNKT cells. Surprisingly, even greater depletion of iNKT cell population occurred in RF mice. This was in part attributable to reduced RF levels of intestinal microbial taxa (Sphingomonas spp.) known to express antigenic glycosphingolipid products. However, memory and activated CD8(+) T cells were also expanded in RF mice, prompting us to test whether CD8(+) T cell activity might be further depleting iNKT cells. Indeed, iNKT cell numbers were restored in RF mice bearing the CD8alpha(-/-) genotype or in adult wild-type RF mice acutely depleted with anti-CD8 Ab. Moreover, iNKT cells were restored in RF mice bearing the Prf1(-/-) phenotype, a key component of cytolytic function. These findings indicate that commensal microbiota, through positive (antigenic drive) and negative (cytolytic depletion by CD8(+) T cells) mechanisms, profoundly shape the iNKT cell compartment. Because individuals greatly vary in the composition of their microbial communities, enteric microbiota may play an important epigenetic role in the striking differences in iNKT cell abundance in humans and therefore in their potential contribution to host immune status.


Figures

Figure 1
Figure 1
Reduced iNKT cells in RF mice and GF mice compared with CF mice. Lymphocytes isolated from spleen, liver, and thymus of age- and gender-matched CF, RF, or GF C57BL/6 mice were analyzed for the presence of iNKT cells by flow cytometry. A, Relative percentage of iNKT cells in spleen, liver, and thymus were identified by positive staining with α-GalCer–loaded CD1d tetramers and anti-mouse TCRβ. Percentage of iNKT cells in the lymphocyte gate from a representative mouse of each group is indicated. PBS-57–loaded CD1d tetramer yielded similar results (data not shown). B, Analysis of NKT cells defined by NK1.1 and TCRβ expression on total liver lymphocytes from CF, GF, and RF mice. Note the partial depletion (GF) and complete deficiency (RF) of NKT cells (intermediate level of NK1.1 and TCRβ) but the preservation of conventional NK cells (high level of NK1.1). C and D, Tabulation of percentages and absolute numbers of α-GalCer tetramer+ iNKT cells in spleen, liver, and thymus of CF versus RF mice (C) and CF versus GF mice (D). The data of GF mice shown are derived from one experiment representative of the results obtained by examining two GF colonies, GF = Swiss Webster mice (Taconic Farms) and GF = C57BL/6 mice (North Carolina State University) in at least three individual experiments with a total of >24 mice per group.
Figure 2
Figure 2
The effects of Sphingomonas spp. in RF intestinal enteric microbiota on iNKT cells. The colonization of Sphingomonas spp. in CF versus RF mice was assayed by PCR for Sphingomonas 16r DNA, and the effects of intestinal inoculation of Sphingomonas on iNKT cells were evaluated in GF mice. A, Sphingomonas-selective PCR of samples from the small and large intestinal mucosal compartments of CF and RF mice. Gel images show the detection of Sphingomonas spp. from four CF versus four RF mice. Arrow indicates amplicons of the anticipated size (303 bp). kb = 1 Kb DNA Ladder (Invitrogen, Carlsbad, CA). Int, intestine. B, Effect of intragastic challenge with S. yanoikuyae on iNKT cells in GF mice. Relative iNKT cell numbers in indicated organs are shown at 24 h after intragastic treatment with PBS (control, squares, n = 4) or S. yanoikuyae (S.yanoi, circles, n = 5). p(liver) = 0.01, p (spleen) = 0.022. C, Expression of CD69 or CD25 on liver iNKT cells from control (tined) or S. yanoikuyae-challenged mice (bold).
Figure 3
Figure 3
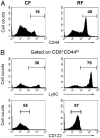
Expanded CD8+ T cells in RF mice display the memory phenotypes. Splenic CD8α+ T cells were analyzed in age- and gender-matched CF and RF mice. A, CD44 expression in CD3ε+CD8α+ lymphocytes. B, CD8α+CD44hi T lymphocytes were gated and analyzed for expression of Ly-6C and CD122. The results are representative of more than three experiments with 24 mice per group.
Figure 4
Figure 4
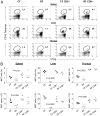
Normal iNKT cell numbers in CD8α−/− mice. The development of iNKT cells in spleen, liver and thymus of CF and RF CD8α−/− mice was examined and compared with age- and gender-matched CF and RF mice. A, Representative FACS data for the relative percentage of iNKT cells (gated on CD3+ T cells) in indicated mouse strains, showing normal development of iNKT cells with increased number and percentage in CF and RF CD8α−/− mice. B, Absolute number and percentage of the cells positive for CD1d tetramer loaded with α-GalCer in total lymphocytes from WT RF mice and CD8α−/− CF or RF mice were compared by using one-way ANOVA method. Values of p for the comparison of RF versus CF and RF CD8α−/− mice are indicated in the respective graphs. No significant differences were observed between CF CD8α−/− mice and RF CD8α−/− mice (p > 0.05).
Figure 5
Figure 5
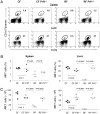
Depletion of CD8+ T cells in RF mice increases iNKT cell numbers. A and B, RF mice were treated with anti-CD8α (or saline, the vehicle control) for 3 wk and analyzed by FACS at 3 d after the last treatment for levels of CD4+ and CD8+ T cells (A) or iNKT cells (B). C, Dynamic change of absolute number of iNKT cells (curves) and percentage of CD8+ T cells (bar graphs) in liver of anti-CD8α Ab-treated RF mice and RF control at indicated time points. Similar results were obtained using an anti-CD8β Ab (data not shown). Absolute numbers of iNKT cells in RF and control RF mice were compared at week 2 and week 3 after anti-CD8α treatment; p values were analyzed by Student t test. Data are representative of three individual experiments and >24 mice per group.
Figure 6
Figure 6
Perforin (Prf1)−/− mice bearing RF microflora have normal iNKT cell numbers. Re-derived Prf1−/− mice bearing RF microflora were examined for the presence of iNKT cells. A, The percentage of PBS-57–loaded CD1d tetramer+ iNKT cells within lymphocytes from spleen and liver of CF, CF Prf1−/−, RF, and RF Prf1−/− mice are indicated. B, Percentages and absolute number (C) of iNKT cells in CF, CF Prf1−/−, RF, and RF Prf1−/− mice in lymphocytes of indicated organs. Statistical analysis of p values using Student t test comparedWTCFversusCFPrf−/−mice,CFPrf−/− versus RF WT, and RF WT versus RF Prf−/− mice were indicated. The data are representative of at least three individual experiments with >12 mice in each group.
Figure 7
Figure 7
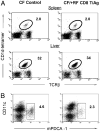
Effect of transferred RF CD8+ T cells on iNKT cell numbers in CF mice. Five- to 6-wk-old CF mice were i.v. transferred with 4 × 10⁷ RF CD8+ T cells and i.p. injected with microbial Ags derived from lumen contents of RF mice (or saline alone as the control) and then sacrificed at day 3 after RF CD8+ T cell transfer. A, Relative percentage of iNKT cells in spleen and liver. B, Relative percentages of pDCs (CD11c+, mPDC-1+) in splenocytes. Representative data from three or more experiments with ≥15 mice in each group.

Similar articles

Cited by

References

    1. Savage DC. Microbial ecology of the gastrointestinal tract. Annu Rev Microbiol. 1977;31:107–133. - PubMed
    1. Conway PL. Microbial ecology of the human large intestine. In: Gibson GR, editor. Human Colonic Bacteria: Role in Nutrition, Physiology, And Pathology. CRC Press; Boca Raton, FL: 1995. pp. 1–24.
    1. Mackie RI, Sghir A, Gaskins HR. Developmental microbial ecology of the neonatal gastrointestinal tract. Am J Clin Nutr. 1999;69:1035S–1045S. - PubMed
    1. Dethlefsen L, McFall-Ngai M, Relman DA. An ecological and evolutionary perspective on human-microbe mutualism and disease. Nature. 2007;449:811–818. - PMC - PubMed
    1. Eckburg PB, Bik EM, Bernstein CN, Purdom E, Dethlefsen L, Sargent M, Gill SR, Nelson KE, Relman DA. Diversity of the human intestinal microbial flora. Science. 2005;308:1635–1638. - PMC - PubMed

Publication types

MeSH terms