. 2010 Feb 26;285(9):6538-51.
doi: 10.1074/jbc.M109.069948. Epub 2010 Jan 4.

G protein betagamma subunits regulate cell adhesion through Rap1a and its effector Radil

Affiliations

G protein betagamma subunits regulate cell adhesion through Rap1a and its effector Radil

Syed M Ahmed et al. J Biol Chem. .

Abstract

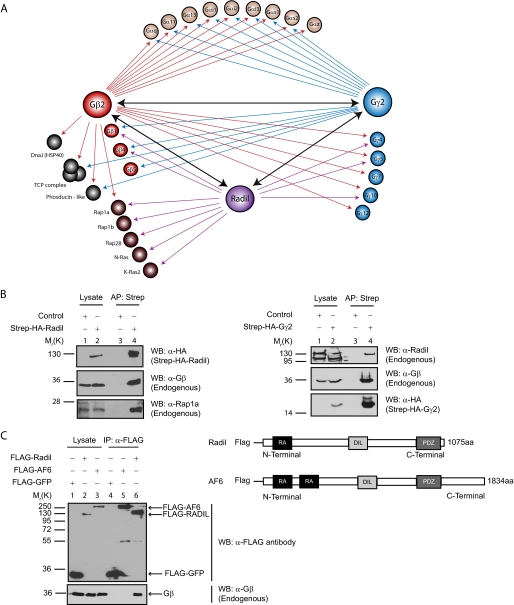
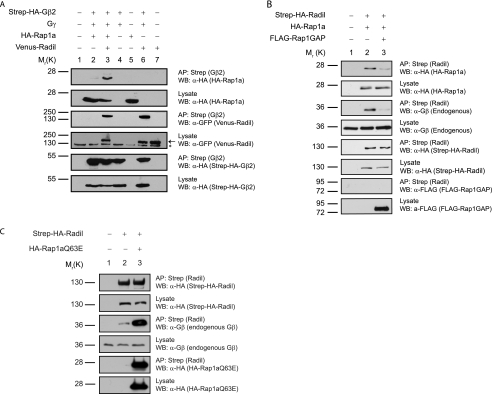
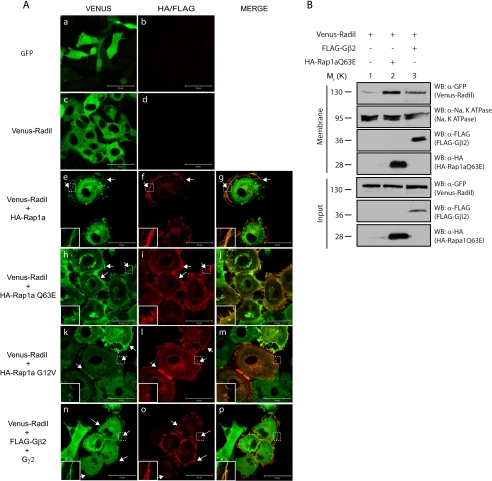
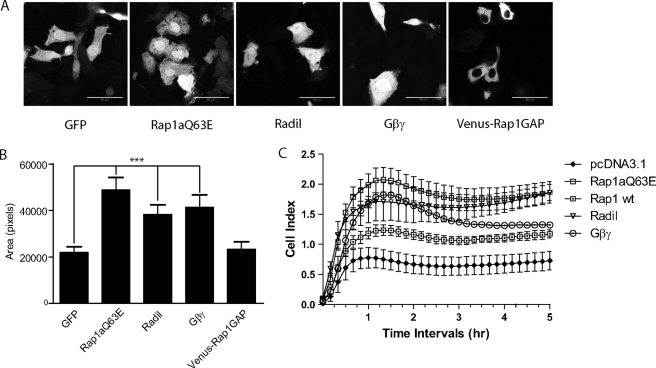
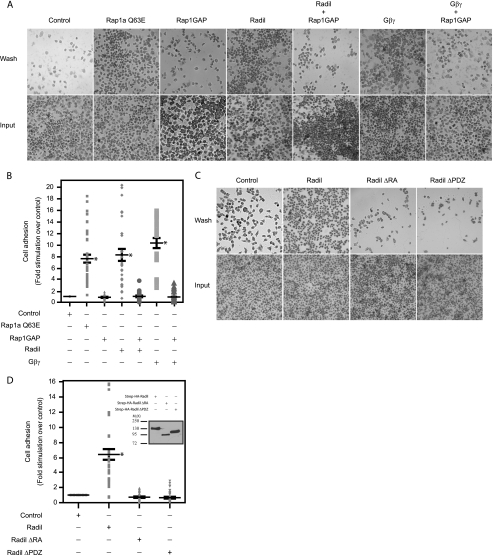
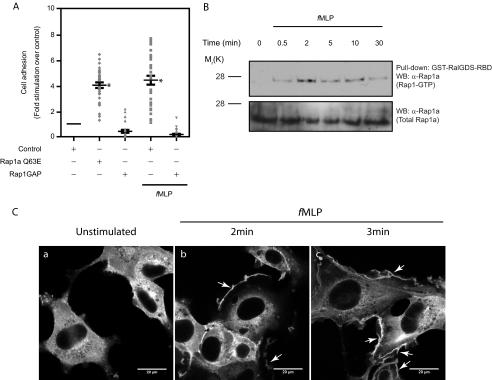
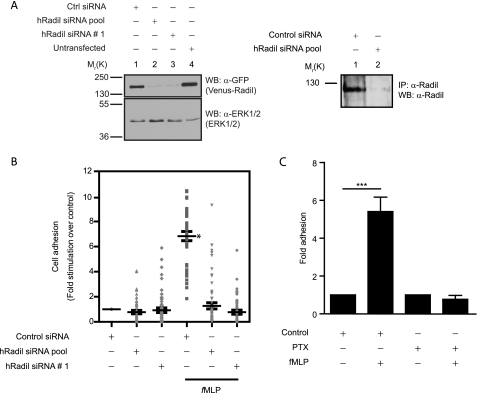
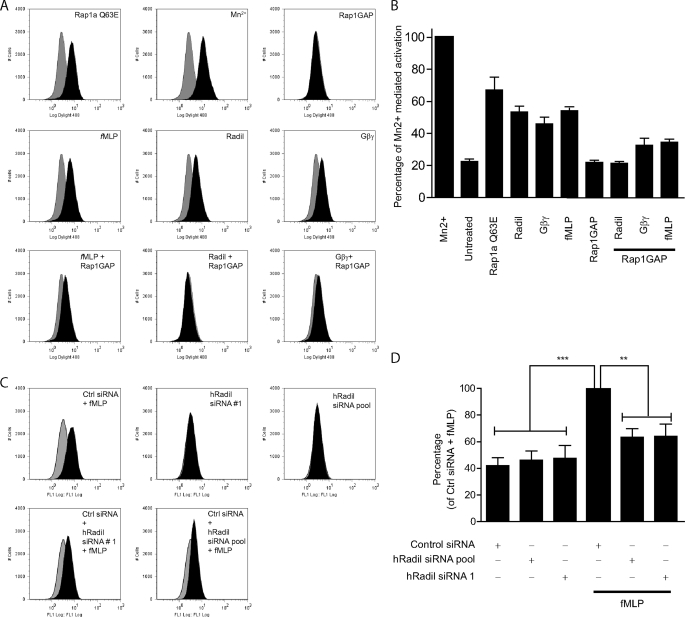
The activation of several G protein-coupled receptors is known to regulate the adhesive properties of cells in different contexts. Here, we reveal that Gbetagamma subunits of heterotrimeric G proteins regulate cell-matrix adhesiveness by activating Rap1a-dependent inside-out signals and integrin activation. We show that Gbetagamma subunits enter in a protein complex with activated Rap1a and its effector Radil and establish that this complex is required downstream of receptor stimulation for the activation of integrins and the positive modulation of cell-matrix adhesiveness. Moreover, we demonstrate that Gbetagamma and activated Rap1a promote the translocation of Radil to the plasma membrane at sites of cell-matrix contacts. These results add to the molecular understanding of how G protein-coupled receptors impinge on cell adhesion and suggest that the Gbetagamma x Rap1 x Radil complex plays important roles in this process.


Figures

FIGURE 1.
FIGURE 1.
Identification of Radil as a novel interactor of Gβγ subunits of heterotrimeric G proteins. A, shown is the protein-protein interaction network of Gβ2, Gγ2, and Radil. Single-headed arrows represent interactions found in Gβ2 (red), Gγ2 (blue), and Radil (purple) pulldown experiments, color coded according to the color of the bait. Dark double-sided arrows represent proteins reciprocally identified using the other as bait. Gβ2 (n = 3), Gγ2 (n = 2), and Radil pulldown assays (n = 2) were performed in HEK293T and HT1080 cells. Analysis of the tandem affinity-purified Gβ2 or Gγ2 protein complexes using mass spectrometry reveals several known Gβγ interactors. The small GTP-binding protein Rap1a and the newly characterized protein Radil were also identified in the Gβ2 complexes. The reciprocal analysis of Radil protein complexes confirmed Radil as a Gβγ-associated protein and also revealed that it binds small G proteins of the Ras family. B, streptavidin affinity purification (AP) of Strep-HA-Radil (left panel) and Strep-HA-Gγ2 (right panel) and immunodetection of co-purified endogenous Gβ, Rap1a, or Radil as indicated validates the mass spectrometry results. WB, Western blot. C, left panel, HEK293T cells were transiently transfected with expression vectors coding for FLAG-GFP, FLAG-Radil, or the closely related FLAG-AF6, and proteins were immunoprecipitated (IP)using α-FLAG M2-conjugated agarose beads followed by a Western blot with α-FLAG (top panel) or α-Gβ (bottom panel) antibodies (n = 3). Gβ co-immunoprecipitates with FLAG-Radil but not with FLAG-GFP or FLAG-AF6. Right panel, a schematic representation of Radil and AF6 proteins shows the similarity between the two proteins containing RA, DIL, and PDZ domains.
FIGURE 2.
FIGURE 2.
Interaction between Gβγ, Rap1a, and Radil. A, Radil physically connects Gβγ and Rap1a. HEK293T cells were transfected with different plasmid combinations coding for Strep-HA-Gβ2, Gγ2, HA-Rap1a, and Venus-Radil. Strep-HA-Gβ2-containing complexes were affinity-purified with streptavidin-Sepharose beads, and the association with Rap1a and Radil was monitored by Western blot (WB) with α-HA and α-GFP antibodies, respectively. The efficiency of Gβ2 purification and expression was also followed by Western blot using HA antibodies. A fraction of the lysates for each samples was probed with α-HA or α-GFP antibodies to assess protein expression. The association of Rap1a with Gβ2 was enhanced when Radil was overexpressed (compare lanes 2 and 3) (n = 3). *, nonspecific band. B, formation of the Gβγ·Rap1a·Radil complex requires active Rap1a. HEK293T cells were transfected with expression plasmids for Strep-HA-Radil and HA-Rap1a only (lane 2) or together with a vector coding for FLAG-Rap1GAP (lane 3). Strep-HA-Radil was purified using streptavidin-Sepharose beads, and its association with Rap1 and Gβ was monitored by a Western blot using α-HA and α-Gβ antibodies, respectively. The expression of Rap1GAP was followed using α-FLAG antibodies. Although HA-Rap1a and Gβ bound to Strep-HA-Radil (lane 2), these interactions were compromised in the presence of overexpressed FLAG-Rap1GAP (lane 3) (n = 4). C, expression of a constitutively active Rap1a mutant (Rap1aQ63E) promotes the interaction of Gβ with Radil. Strep-HA-Radil expressing stable cells were transfected or not with HA-Rap1aQ63E. 48 h after transfection, Radil was affinity-purified with streptavidin-Sepharose beads for 1.5 h, and the eluates were analyzed by Western blot using the indicated antibodies. Untransfected HEK293T cells were used as the negative control for streptavidin purification. AP, affinity purification. Mr, molecular weights. K, ×1000.
FIGURE 3.
FIGURE 3.
Rap1a-GTP and Gβγ promote the translocation of Radil at cell-matrix contacts in HT1080 cells. A, shown is localization of GFP (a and b), Venus-Radil (c and d), or Venus-Radil co-expressed with wild-type HA-Rap1 (e–g), HA-Rap1aQ63E (h–j), HA-Rap1G12V (k–m), or FLAG-Gβ2/Gγ1 (n–p). HA- and FLAG-tagged Rap1a or Gβ2 + Gγ (untagged) were transiently transfected in HT1080 cells stably expressing Venus-Radil as indicated. Cells were fixed followed by immunodetection with α-HA (e–m) or α-FLAG (n–p) monoclonal antibody followed by secondary detection with goat-anti-mouse conjugated to Alexa 594 antibody. Cells were visualized using a Zeiss LSM 510 confocal microscope under 63× oil immersion objective. White arrows depict plasma-membrane co-localization. White boxes indicate magnified sections cropped in Adobe Photoshop CS3. Images shown are representative of 10–15 cells analyzed in three independent experiments. Bars, 50 μm. B, membrane fractions show enrichment of Venus-Radil when Rap1aQ63E and Gβγ are expressed. HT1080 cells stably expressing Venus-Radil were transiently transfected to express the indicated proteins. Cells were lysed in hypotonic buffer and subjected to subcellular fractionation as described under “Experimental Procedures.” Membrane fractions and the inputs were analyzed by Western blot (WB) to determine the amount of Venus-Radil present in the membrane pool when HA-Rap1aQ63E or FLAG-Gβ2 was co-expressed. The blot for the membrane fractions was stripped and re-probed using α-Na-K-ATPase antibody to provide for an internal loading control.
FIGURE 4.
FIGURE 4.
The Gβγ·Rap1·Radil complex increases HT1080 cell spreading. A, HT1080 cells were plated on coverslips and transiently transfected with cDNA for GFP alone or together with HA-Rap1aQ63E, HA-Radil, and HA-Gβ2+Gγ. Cells transfected with Venus-Rap1GAP alone were also used as a control. 48 h post-transfection cells were fixed and visualized using a confocal microscope under 63× oil immersion objective. Bars, 50 μm. B, the spreading of cells co-expressing GFP and the indicated proteins was quantified by taking the total surface area for each cells using the Image J software. A total of 50–70 cells were analyzed. Error bars represent ± S.E. Statistical significance was analyzed using one-way ANOVA followed by Tukey's multiple comparison test; p < 0.05. C, HT1080 cells were transfected with the indicated cDNAs. 48 h post-transfections cells were trypsinized and resuspended in DMEM, 10% fetal bovine serum media. Cells were counted, 25,000 cells were plated on a 96-well xCELLigence microtiter plate (E-Plate), and the change in cell index was measured using the xCELLigence impedance system. Error bars represent ±S.D. Data shown are representative of two independent experiments. wt, wild type.
FIGURE 5.
FIGURE 5.
Radil and Gβγ promote adhesion of HT1080 cells on fibronectin matrix in a Rap1a dependent manner. A, shown are representative pictures of HT1080 cell adhesion assays in response to overexpression of different proteins as indicated. FLAG-GFP cDNA was transfected as control. Top panels show the remaining adherent cells after washes. The bottom panels demonstrate the total cells input for each conditions. B, shown is a quantified representation of the adhesion assay as -fold stimulation compared with control. C, shown are representative pictures comparing the ability of ΔRA and ΔPDZ Radil mutants to promote HT1080 cells adhesion. D, shown is a quantified representation of C. The inset shows expression of the different Radil proteins in one representative experiment. Each experiment was done in triplicate, and several pictures from random fields were taken from each well of 96-well plate. Cells were counted (using an automated cell counting macro created in ImageJ software) from each field and expressed as -fold of control from each experiment. The results from three independent experiments were pooled for the quantification. Each dot on the graph represents cell counts from a single field. Error bars, ±S.E. Statistics are one-way ANOVA followed by Tukey's multiple comparison test; p < 0.05. Asterisks indicate statistical significance compared with control.
FIGURE 6.
FIGURE 6.
fMLP promotes Rap1-dependent HT1080 cell adhesion, Rap1 activation, and Radil translocation to the plasma membrane. A, HT1080 cell adhesion on a fibronectin matrix is shown with or without fMLP (100 nm) stimulation in the presence or absence of Rap1GAP. Rap1aQ63E (used as a positive control) shows the increase in cell adhesion (n = 3). B, shown is the time course of Rap1 activation by fMLP (100 nm) in HT1080 cells. The top panel shows GTP-bound Rap1a, purified using GST-RalGDS-RBD pulldown assays. The bottom panel shows total Rap1 in a fraction of whole cell lysates from each sample. Western blotting (WB) was done using α-Rap1a antibodies. C, HT1080 cells stably expressing Venus-Radil were serum-starved for 24 h and stimulated or not with fMLP (1 μm) for 0 min (a), 2 min (b), 3 min (c) at 37 °C. Arrows highlight regions of Venus-Radil enrichment at the plasma membrane. Images were captured by a blinded observer using 100× oil-immersion lens. Images shown are representative of two independent experiments. Bars, 20 μm.
FIGURE 7.
FIGURE 7.
Radil is required for the fMLP-promoted HT1080 cell adhesion on fibronectin matrix. A, shown is efficiency of Radil knockdown. HT1080 cells stably expressing Venus-Radil were treated with control, a pool of four Radil siRNAs (hRadil siRNA pool), or a single Radil siRNA (hRadil siRNA #1) (left panel), and Radil expression was monitored by Western blot (IP) using GFP antibodies. Immunoblotting with total Erk1/2 antibodies was performed as loading controls. Endogenous hRadil knockdown efficiency in HT1080 cells using the hRadil siRNA pool is shown in the right panel. Cells transfected with control or hRadil siRNA pool were lysed, and equivalent amounts of lysates were immunoprecipitated (IP) using α-Radil rabbit polyclonal antibodies followed by detection in Western blot using the same antibody. B, shown is fMLP-promoted cell adhesion in HT1080 cells treated with control or hRadil siRNAs (n = 4). Each dot on the graph represents counts from a single field. The asterisk indicates statistical significance compared with control treatment. C, treatment of HT1080 cells with PTX (100 ng/ml) inhibits fMLP-mediated cell adhesion. Each experiment was done in triplicate, and several pictures from random fields were taken from each well of a 96-well plate. Cells were counted from each field and expressed as -fold of control from each experiment. Data from all experiments were pooled. Error bars, ±S.E. Statistical significance was assessed using one-way ANOVA followed by post-hoc analysis using Tukey's multiple comparison test; p < 0.05.
FIGURE 8.
FIGURE 8.
β1 integrin activation. A, representative flow cytometry analysis shows β1 integrin activation upon the indicated treatments. The gray area represents control staining with 9EG7 monoclonal antibody antibodies that specifically recognize activated β1-integrins. The black area corresponds to the treated population. Rap1aQ63E, Mn2+v and Rap1GAP are used as controls. B, shown is the average of three independent experiments performed as in A showing β1 integrin activation upon the different treatments. Error bars, ± S.E. C, flow cytometry analysis shows β1 integrin activation in the presence or absence of fMLP in HT1080 cells treated with control (Ctrl) or hRadil siRNAs. D, shown is the average of three independent experiments performed as in C. Error bars, ±S.E. Statistics are one-way ANOVA followed by post-hoc analysis using Tukey's multiple comparison test; p < 0.05.

Similar articles

Cited by

References

    1. Doitsidou M., Reichman-Fried M., Stebler J., Köprunner M., Dörries J., Meyer D., Esguerra C. V., Leung T., Raz E. (2002) Cell 111, 647–659 - PubMed
    1. Scott I. C., Masri B., D'Amico L. A., Jin S. W., Jungblut B., Wehman A. M., Baier H., Audigier Y., Stainier D. Y. (2007) Dev. Cell 12, 403–413 - PubMed
    1. Carmona G., Chavakis E., Koehl U., Zeiher A. M., Dimmeler S. (2008) Blood 111, 2640–2646 - PubMed
    1. Servant G., Weiner O. D., Herzmark P., Balla T., Sedat J. W., Bourne H. R. (2000) Science 287, 1037–1040 - PMC - PubMed
    1. Höpken U. E., Lu B., Gerard N. P., Gerard C. (1996) Nature 383, 86–89 - PubMed

Publication types

MeSH terms