. 2010 Mar 5;285(10):7045-55.
doi: 10.1074/jbc.M109.079277. Epub 2010 Jan 4.

Src-induced tyrosine phosphorylation of VE-cadherin is not sufficient to decrease barrier function of endothelial monolayers

Affiliations

Src-induced tyrosine phosphorylation of VE-cadherin is not sufficient to decrease barrier function of endothelial monolayers

Alejandro P Adam et al. J Biol Chem. .

Abstract

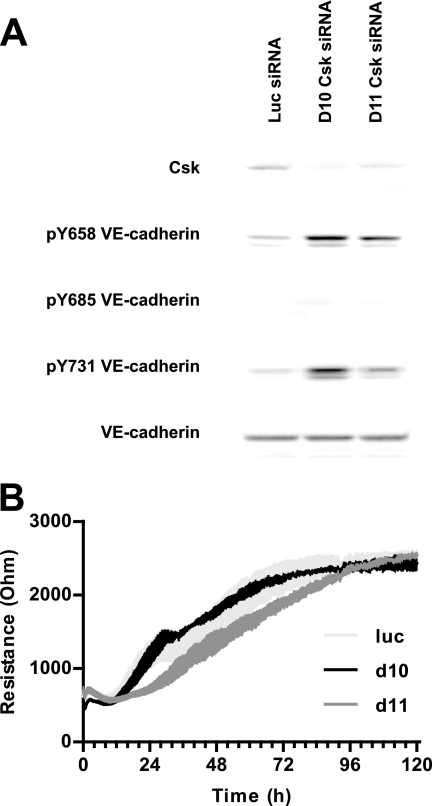
Activation of Src family kinases (SFK) and the subsequent phosphorylation of VE-cadherin have been proposed as major regulatory steps leading to increases in vascular permeability in response to inflammatory mediators and growth factors. To investigate Src signaling in the absence of parallel signaling pathways initiated by growth factors or inflammatory mediators, we activated Src and SFKs by expression of dominant negative Csk, expression of constitutively active Src, or knockdown of Csk. Activation of SFK by overexpression of dominant negative Csk induced VE-cadherin phosphorylation at tyrosines 658, 685, and 731. However, dominant negative Csk expression was unable to induce changes in the monolayer permeability. In contrast, expression of constitutively active Src decreased barrier function and promoted VE-cadherin phosphorylation on tyrosines 658 and 731, although the increase in VE-cadherin phosphorylation preceded the increase in permeability by 4-6 h. Csk knockdown induced VE-cadherin phosphorylation at sites 658 and 731 but did not induce a loss in barrier function. Co-immunoprecipitation and immunofluorescence studies suggest that phosphorylation of those sites did not impair VE-cadherin ability to bind p120 and beta-catenin or the ability of these proteins to localize at the plasma membrane. Taken together, our data show that Src-induced tyrosine phosphorylation of VE-cadherin is not sufficient to promote an increase in endothelial cell monolayer permeability and suggest that signaling leading to changes in vascular permeability in response to inflammatory mediators or growth factors may require VE-cadherin tyrosine phosphorylation concurrently with other signaling pathways to promote loss of barrier function.


Figures

FIGURE 1.
FIGURE 1.
VEGF-induced VE-cadherin tyrosine phosphorylation and increased permeability depend on SFK activity in HDMEC monolayers. A, confluent, mature monolayers of HDMECs were serum-starved for 16 h (0.3% fetal bovine serum in EBM-2 medium, see “Experimental Procedures”), incubated with 10 μm PP1 Src kinase inhibitor or 0.1% DMSO (control) for 1 h, and then treated with 50 ng/ml VEGF or vehicle (0.1% bovine serum albumin in PBS) for different times prior to lysis. Western blot analysis using phospho-specific antibodies shows a fast increase in VE-cadherin phosphorylation that quickly reverses. Src activity inhibition by PP1 pretreatment blocks VEGF-induced phosphorylation. pY658, phospho-Tyr-658; pY685, phospho-Tyr-685; pY731, phospho-Tyr-731; pY416, phospho-Tyr-416; pY118, phospho-Tyr-118. B, HDMEC monolayers were treated as above, and electric resistance was measured by ECIS at 4000 Hz (n = 3). Results are representative of at least three independent experiments.
FIGURE 2.
FIGURE 2.
Overexpression of DN-Csk induces tyrosine kinase signaling but does not increase monolayer permeability. A, confluent, mature monolayers of HDMECs were infected with adenovirus to express either GFP (1.7 × 10⁹ pfu/ml) or DN-Csk (1.8 × 10⁸ to 7.2 × 10⁸ pfu/ml), and 24 h later, cells were lysed and probed for Csk expression and total phosphotyrosine content by Western blot. β-actin blots served as loading control. B, confluent monolayers of HDMECs were infected with 7.2 × 10⁸ pfu/ml DN-Csk virus at time 0 and lysed 3–12 h after infection. Cell lysates were then probed for Csk expression, total phosphotyrosine content, and phosphorylated Tyr-527 (inactive) Src. C, confluent monolayers were infected with adenovirus to express either GFP or DN-Csk (pfu/ml as indicated). Monolayer resistance was measured by ECIS at 4000 Hz. A two-way repeated measures analysis of variance was performed with Bonferroni post tests versus GFP-infected wells values (n = 2). No significant changes were detected upon DN-Csk overexpression. Results are representative of at least three independent experiments.
FIGURE 3.
FIGURE 3.
DN-Csk overexpression induces changes in the cell-cell borders. A, confluent, mature monolayers of HDMECs were infected with adenovirus to express either GFP or DN-Csk and fixed 24 h later. The levels and localization of active (pTyr-416) Src (pY416 Src) were determined by indirect immunofluorescence. Ctrl, control. B, HDMECs were infected with adenovirus to overexpress GFP or DN-Csk and fixed 6, 18, or 30 h after infection. Cells were stained for VE-cadherin (red) or nuclei (4′,6-diamidino-2-phenylindole, blue). White arrows point to areas of cytoplasmic overlay in DN-Csk-overexpressing cells. Results are representative of at least three independent experiments.
FIGURE 4.
FIGURE 4.
Overexpression of caSrc induces a robust decrease in monolayer barrier function. A, confluent, mature monolayers of HDMECs were infected with adenovirus to express GFP (1.7 × 10⁹ pfu/ml), DN-Csk (7.2 × 10⁸ pfu/ml), or caSrc (3.2 × 10⁶ pfu/ml), and 6–12 h later, cells were lysed and probed for Csk and Src expression, total phosphotyrosine content, and Src activation (pY416 Src) by Western blot. β-actin blots served as loading control. B, confluent monolayers were infected as in A, and monolayer resistance was measured by ECIS at 4000 Hz. A two-way repeated measures analysis of variance was performed with Bonferroni post tests versus GFP-infected wells values (n = 4). The arrow marks the first time point in which caSrc induced a significant decrease in cell permeability (p < 0.001). No significant changes were detected upon DN-Csk overexpression. Results are representative of five independent experiments. Error bars show S.D. (n ≥ 3).
FIGURE 5.
FIGURE 5.
DN-Csk expression and downstream SFK signaling induce VE-cadherin phosphorylation but do not induce change in cell permeability. A, HDMECs were infected with adenovirus to overexpress GFP, DN-Csk, or caSrc and lysed 6–12 h later. Cell lysates were assayed by Western blot for VE-cadherin phosphorylation at tyrosines 658 (pY658), 685 (pY685), and 731 (pY731). Total VE-cadherin blots served as loading control. pY118, phospho-Tyr-118. B, confluent HDMEC monolayers were infected with 6.8 × 10⁹ pfu/ml GFP virus, 7.2 × 10⁸ pfu/ml DN-Csk virus (labeled DN-Csk), 2.88 × 10⁹ pfu/ml DN-Csk virus (labeled 4X DN-Csk), or 3.2 × 10⁶ pfu/ml caSrc virus and lysed 24 or 48 h later. Lysates were immunoblotted for VE-cadherin phosphorylation, phospho-Tyr-188 paxillin, or Csk to document infection levels. Total VE-cadherin and β-actin blots served as loading controls; NI, non-infected. C, HDMEC cells were infected with adenovirus to express GFP or increasing amounts of DN-Csk at time 0. Monolayer resistance was measured by ECIS at 4000 Hz. D, HDMEC cells were infected with adenovirus to express GFP or different amounts of caSrc at time 0. Monolayer resistance was measured as above. A two-way repeated measures analysis of variance was performed with Bonferroni post tests versus GFP-infected wells values (n = 3). No significant differences were observed at any DN-Csk infection amount at any time point. Results are representative of three independent experiments. Error bars show S.D. (n ≥ 3).
FIGURE 6.
FIGURE 6.
DN-Csk and caSrc overexpression does not prevent VE-cadherin binding to p120 and β-catenin or co-localization to the adherens junctions. A, HDMECs were infected with adenovirus to overexpress GFP, DN-Csk, or caSrc and fixed 24 h later. Cells were then stained with antibodies against p120 (green) and VE-cadherin (red). Nuclei were stained with 4′,6-diamidino-2-phenylindole (DAPI) (blue). The white arrows point to the sites of cell-cell overlapping, which still showed p120 and VE-cadherin co-localization. B, HDMECs were infected with adenovirus to overexpress GFP, DN-Csk, or caSrc and lysed 16 h after infection. Immunoprecipitates (IP) of p120, β-catenin (β-cat), or VE-cadherin (VE-cad) were run on SDS-PAGE together with beads only precipitates (IP Ctrl) and total cell lysates (TCL) and immunoblotted as described in the figure. β-actin was used as loading control in the total cell lysates, whereas Src and Csk immunoblots served as infection controls. Results are representative of three independent experiments.
FIGURE 7.
FIGURE 7.
siRNA-mediated Csk knockdown promotes Tyr-658 (pY658) and Tyr-731 (pY731) but not Tyr-685 (pY685) VE-cadherin phosphorylation and does not increase monolayer permeability. A, HDMEC cells were electroporated with 2 μg of luciferase (Luc)- or Csk-specific siRNAs, and 72 h later, Csk expression and VE-cadherin phosphorylation were assessed by Western blot. Total VE-cadherin blots served as loading control. B, after siRNA electroporation, HDMEC cells were seeded onto ECIS chambers for monolayer resistance monitoring. Notice the increase in resistance after seeding, due to cell spreading, proliferation, and cell-cell contact maturation, that reaches a plateau after ∼96 h after seeding. Csk-siRNA-carrying cells show the same increase in resistance as control cells. Error bars show S.D. (n ≥ 3).
FIGURE 8.
FIGURE 8.
DN-Csk- and caSrc-induced signaling depends on continuous SFK activity. HDMEC cells were infected with adenovirus to overexpress GFP, DN-Csk, or caSrc for 18 h and maintained in EBM-2 medium with 0.3% fetal bovine serum and no other added factors. Cells were then incubated for 6 h in the presence of 10 μm PP1 or 0.1% DMSO prior to lysis and Western blot analysis to assess VE-cadherin phosphorylation (A) and Erk and Akt activation (B). Total VE-cadherin, total Erk, and total Akt blots served as loading control. Results are representative of at least three independent experiments. pY658, phospho-Tyr-658; pY685, phospho-Tyr-685; pY731, phospho-Tyr-731; pErk1/2, phospho-Erk1/2; pAkt, phospho-Akt.

Similar articles

Cited by

References

    1. Xiao K., Allison D. F., Buckley K. M., Kottke M. D., Vincent P. A., Faundez V., Kowalczyk A. P. (2003) J. Cell Biol. 163, 535–545 - PMC - PubMed
    1. Hartsock A., Nelson W. J. (2008) Biochim. Biophys. Acta 1778, 660–669 - PMC - PubMed
    1. Iyer S., Ferreri D. M., DeCocco N. C., Minnear F. L., Vincent P. A. (2004) Am. J. Physiol. Lung Cell Mol. Physiol. 286, L1143–L1153 - PubMed
    1. Vestweber D. (2008) Arterioscler. Thromb. Vasc. Biol. 28, 223–232 - PubMed
    1. Ha C. H., Bennett A. M., Jin Z. G. (2008) J. Biol. Chem. 283, 7261–7270 - PMC - PubMed

Publication types

MeSH terms