. 2010 Jan 18;207(1):141-53.
doi: 10.1084/jem.20092238. Epub 2010 Jan 4.

Altering the spectrum of immunoglobulin V gene somatic hypermutation by modifying the active site of AID

Affiliations

Altering the spectrum of immunoglobulin V gene somatic hypermutation by modifying the active site of AID

Meng Wang et al. J Exp Med. .

Abstract

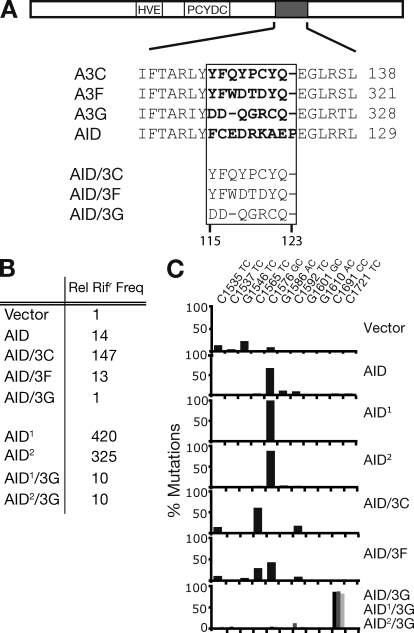
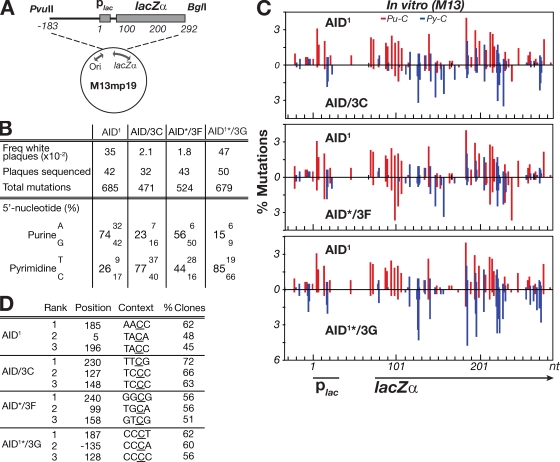
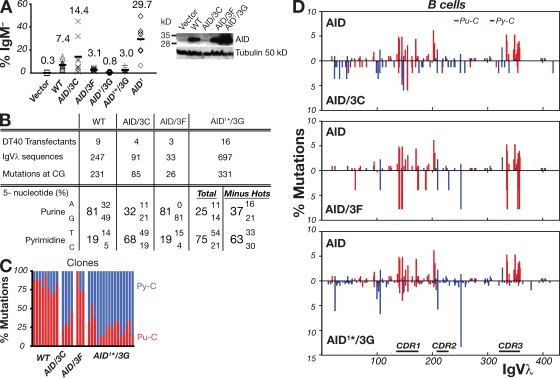
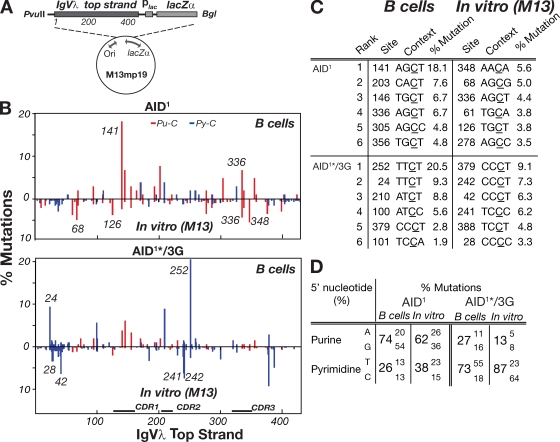
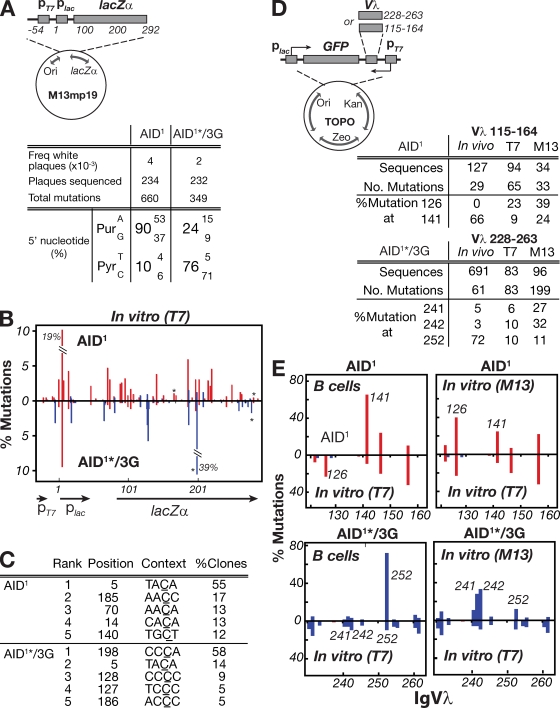
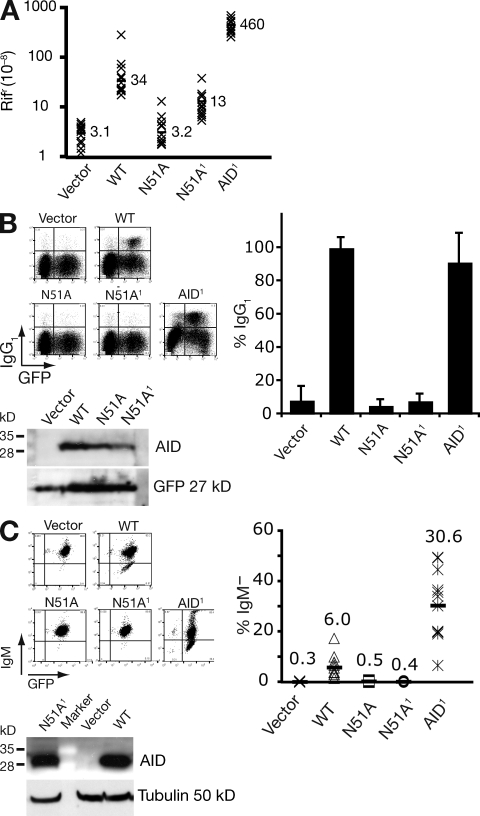
High-affinity antibodies are generated by somatic hypermutation with nucleotide substitutions introduced into the IgV in a semirandom fashion, but with intrinsic mutational hotspots strategically located to optimize antibody affinity maturation. The process is dependent on activation-induced deaminase (AID), an enzyme that can deaminate deoxycytidine in DNA in vitro, where its activity is sensitive to the identity of the 5'-flanking nucleotide. As a critical test of whether such DNA deamination activity underpins antibody diversification and to gain insight into the extent to which the antibody mutation spectrum is dependent on the intrinsic substrate specificity of AID, we investigated whether it is possible to change the IgV mutation spectrum by altering AID's active site such that it prefers a pyrimidine (rather than a purine) flanking the targeted deoxycytidine. Consistent with the DNA deamination mechanism, B cells expressing the modified AID proteins yield altered IgV mutation spectra (exhibiting a purine-->pyrimidine shift in flanking nucleotide preference) and altered hotspots. However, AID-catalyzed deamination of IgV targets in vitro does not yield the same degree of hotspot dominance to that observed in vivo, indicating the importance of features beyond AID's active site and DNA local sequence environment in determining in vivo hotspot dominance.


Figures

Figure 1.
Figure 1.
Changing the target specificity of AID. (A) Depiction of AID cDNA showing the Zn coordination domain (HVE and PCYDC), and the region containing a putative substrate contact loop (gray), with alignment to equivalent regions of APOBEC3C, 3F, and 3G shown below. Residues predicted to be in the substrate contact loop are highlighted in bold. In the AID chimeras, residues 115–123 of AID were replaced by equivalent residues in APOBEC3C/F/G as indicated. (B) Bacterial mutator activity of variant AIDs was determined by the mean frequency from 12 independent cultures with which they yielded colonies resistant to rifampicin (Rifr), expressed relative to that given by the vector-only control. AID1 and AID2 are previously described upmutants of wild-type AID (AID1: K10E/T82I/E156G; AID2: K34E/E156G/R157T; Wang et al., 2009). (C) Target specificity of the various AID-derived deaminases as judged by the distribution of rpoB mutations in rifr resistant colonies. Transition mutations at any one of eleven C:G pairs within rpoB can give rise to Rifr. Mutations at a specific C:G pair are expressed as a percentage of the total number of Rifr colonies scored for each deaminase. Results with AID/3G are shaded black, AID1/3G in dark gray, and AID2/3G in light gray (all largely target C1691).
Figure 2.
Figure 2.
Mutation spectrum of modified AIDs assayed in vitro on a gapped duplex lacZ target. (A) Depiction of the M13mp19lacZ gapped duplex substrate DNA. (B) 5′-flanking nucleotide preferences of the C mutations produced by the variant AID deaminases. The spectra shown for the AID/3G chimera is from an AID1*/3G derivative in which the asterisk denotes that the protein has been truncated at amino acid position 190 of AID (removing the nuclear export sequence) and is shown to allow comparison with the same AID variant analyzed in transfected DT40 B cells (see Fig. 3). The C-terminal truncations do not detectably alter the patterns of in vitro mutational targeting. (C) Distribution of mutations over a 310-nt stretch of the single-stranded lacZ target. The numbers of independent mutations at each nucleotide position are expressed as a percentage of the total mutation database (as analyzed over the entire 475-nt single-stranded target). Nucleotide position 1 is defined as the start of the lac promoter. Mutations at C residues flanked by a 5′-purine (Pu-C) are shown in red, those flanked by a 5′-pyrimidine (Py-C) in blue. (D) Identity of the three most frequently targeted residues by each deaminase, with targeting expressed as the percentage of clones analyzed in which the relevant cytosine (underlined) was mutated.
Figure 3.
Figure 3.
Modified AIDs give altered IgVλ hypermutation spectra in B cells. (A) Hypermutation of IgVλ was assayed by monitoring surface IgM-loss in AID−/− ψV−/− sIgM+ DT40 cells that had been stably transfected with constructs coexpressing the indicated AID mutants together with GFP. For each construct, the percentage of surface IgM-loss variants in 8–12 independent clonal transfectants were determined 3 wk after subculturing. On the right, Western blots representative of multiple clones show AID abundance in the DT40 cell extracts, with tubulin as loading control. (B) 5′-flanking nucleotide preferences of the IgVλ C mutations produced by the variant AID deaminases in the DT40 clonal transfectants. The compilations are based on mutations detected in unsorted DT40 cells analyzed 8 wk after transfection, except for AID/3C, where sequences from both unsorted and sorted sIgM populations contributed to the mutation database. In the case of AID1*/3G, the nucleotide preferences are given based on an analysis of all the mutations in the dataset, as well as from an analysis in which the four major hotspots were removed from the calculations. (C) Percentage of mutated C residues flanked by 5′-purine (red) or 5′-pyrimidine (blue) in IgVλ sequences analyzed from individual expanded DT40 clonal transfectants represented by each bar. (D) Distribution of IgVλ mutations in the DT40 transfectants, in each comparing the spectrum achieved with a modified AID (below the line) to that achieved with wild-type AID (above the line). Mutations (which were >95% at C:G pairs) were computed as being caused by C deamination with those Cs flanked by a 5′-purine (Pu-C) indicated in red and those by a 5′-pyrimidine (Py-C) in blue. Further details on the mutations obtained with these deaminases, as well as with AID1 are shown in Fig. S2 and Fig. S3.
Figure 4.
Figure 4.
Different IgVλ hotspots dominate the mutation spectra in B cells and in the gapped duplex assay. (A) The M13mp19-IgVλ-lacZ gapped duplex substrate DNA is depicted with more detailed information provided in Fig. S5 A. Nucleotide position 1 is equivalent to the first nucleotide of the in vivo IgVλ analyzed in Fig. 3. (B) The graphs compare the distribution of IgVλ mutations obtained with AID1 or AID1*/3G in the gapped duplex assay (shown below the line) with the distribution of IgVλ top strand C mutations obtained with the same deaminases in DT40 B cells (shown above the line). The distributions of IgVλ top strand C mutations in DT40 cells for AID1*/3G and AID1 derive from the same mutation databases used in Fig. 3 and Fig. S2, respectively, although those figures portray all C mutations (i.e., whichever DNA strand they have occurred upon). The positions of some individual hotspots are indicated in italics. Red, 5′-purine flank (Pu-C); blue, 5′-pyrimidine flank (Py-C). (C) The location and local context of the most frequently mutated C residues along the IgVλ top strand in the gapped duplex and DT40 B cell mutation assays are compared. Mutation load at each nucleotide position is represented as a percentage of the total mutations in each dataset. (D) The percentages of total C mutations in the gapped duplex assays and DT40 B cells (top strand) at C residues with each of the four possible 5′-flanking bases are compared for AID1 and AID1*/3G.
Figure 5.
Figure 5.
Mutation spectra from in vitro transcription-coupled mutation assays. (A) The T7-lacZ transcription-coupled substrate in which a T7 promoter is inserted upstream of the lac promoter in M13mp19 (Fig. S5 B). Nucleotide position 1 is defined as the start of the lac promoter. The adjacent table shows the 5′-flanking nucleotide preferences of the C mutations produced by GST-AID1 or GST-AID1*/3G in lac target DNA during in vitro transcription by phage T7 RNA polymerase. (B) Mutation distribution along the T7 transcription-coupled lacZ target DNA with mutation at each nucleotide position expressed as the percentage of total mutations. Two heavily mutated positions are off-scale: their percentage mutations are indicated. Because mutation analysis was restricted to Lac plaques, this selection results in a skewing in favor of lac-inactivating mutations, although most mutated templates carried 1–3 mutations in the target region. Positions at which C deamination yields a stop codon are indicated by an asterisk. (C) The location and local context of the five most frequently mutated C residues along the transcribed lac target. All the mutated residues shown are located on the top (nontranscribed) strand. (D) Transcription-linked mutation of a T7-linked GFP-Vλ target. The substrate DNA is a derivative of plasmid pCR-Blunt II-TOPO in which a region of IgVλ (residues 115–164 or 228–263) has been inserted between the T7 promoter and a GFP reporter with T7-catalyzed transcription of the IgVλ fragment being in the same sense as IgVλ transcription in B cells (Fig. S5 C). For each construct (pCR-GFP-Vλ115−164-T7 and pCR-GFP-Vλ228−263-T7), the tables compare the percentage of total mutations within the target Vλ region that occur at selected individual positions with the equivalent percentage mutation values for the same positions over the same target regions in the M13 or B cell mutation assays. (E) Comparison of the mutation distributions obtained in the T7-coupled mutation assay over IgVλ residues 115–164 (for AID1) or 228–263 (for AID1*/3G) to the distributions obtained in DT40 B cells (left) or in the gapped duplex assay (right). In these comparisons, analysis is restricted to nontranscribed strand mutations. Positions of individual hotspots are indicated in italics. Red, 5′-purine flank; blue, 5′-pyrimidine flank.
Figure 6.
Figure 6.
AID N51A mutants retain DNA deaminase activity. (A) Bacterial mutator activity of AID variants monitored by frequency of Rifr colonies in overnight cultures with mean frequencies (x10−8) from 12 independent cultures indicated. The N51A mutant of AID1 is abbreviated N51A1. (B) Switching to IgG1 in LPS+IL-4 cultures of AID-deficient B cells that have been transduced with retroviruses encoding the various AIDs as indicated together with a linked IRES-GFP. Representative flow cytometry plots are presented along with histograms showing the results of four experiments (mean and SD, with 2–3 mice per construct per experiment). AID abundance in the B cell extracts 3 d after retroviral transduction was monitored by Western blotting; the blot was reprobed with anti-GFP antibodies as a control. (C) The frequency of surface IgM-loss variants in transfectants of AID−/− ψV−/− sIgM+ DT40 that coexpress the indicated AID mutant and GFP is presented both with a histogram showing the average percentage sIgM-loss variants in 12 independent clonal transfectants as well as by representative flow cytometry plots. Representative Western blots show AID abundance in the DT40 cell extracts with tubulin as loading control.

References

    1. Alt F.W., Honjo T. 2007. Advances in Immunology Vol. 94: AID for Immunoglobulin Diversity; Elsevier, Amsterdam
    1. Arakawa H., Saribasak H., Buerstedde J.M. 2004. Activation-induced cytidine deaminase initiates immunoglobulin gene conversion and hypermutation by a common intermediate. PLoS Biol. 2:E179 10.1371/journal.pbio.0020179 - DOI - PMC - PubMed
    1. Barreto V., Reina-San-Martin B., Ramiro A.R., McBride K.M., Nussenzweig M.C. 2003. C-terminal deletion of AID uncouples class switch recombination from somatic hypermutation and gene conversion. Mol. Cell. 12:501–508 10.1016/S1097-2765(03)00309-5 - DOI - PubMed
    1. Basu U., Chaudhuri J., Alpert C., Dutt S., Ranganath S., Li G., Schrum J.P., Manis J.P., Alt F.W. 2005. The AID antibody diversification enzyme is regulated by protein kinase A phosphorylation. Nature. 438:508–511 10.1038/nature04255 - DOI - PubMed
    1. Beale R.C., Petersen-Mahrt S.K., Watt I.N., Harris R.S., Rada C., Neuberger M.S. 2004. Comparison of the differential context-dependence of DNA deamination by APOBEC enzymes: correlation with mutation spectra in vivo. J. Mol. Biol. 337:585–596 10.1016/j.jmb.2004.01.046 - DOI - PubMed

Publication types

Substances