. 2010 Apr 16;285(16):11998-2010.
doi: 10.1074/jbc.M109.046243. Epub 2010 Jan 4.

Humanized SFTPA1 and SFTPA2 transgenic mice reveal functional divergence of SP-A1 and SP-A2: formation of tubular myelin in vivo requires both gene products

Affiliations

Humanized SFTPA1 and SFTPA2 transgenic mice reveal functional divergence of SP-A1 and SP-A2: formation of tubular myelin in vivo requires both gene products

Guirong Wang et al. J Biol Chem. .

Abstract

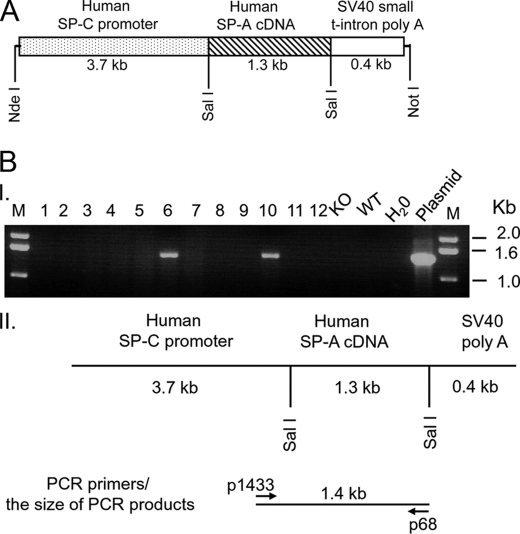
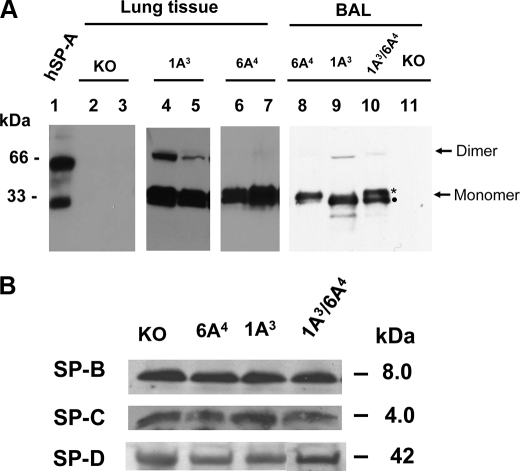
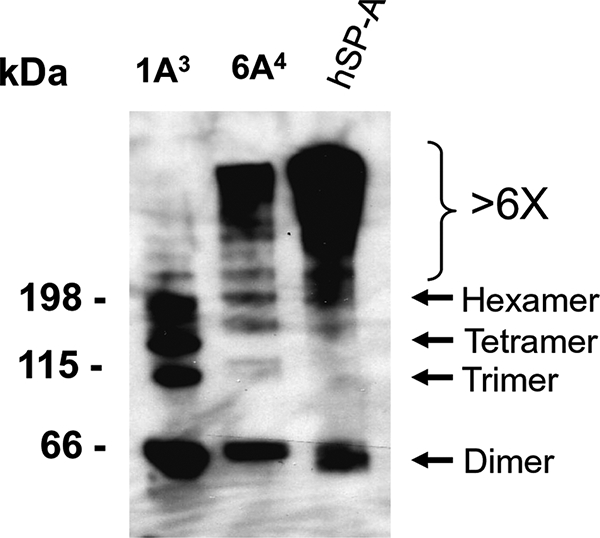
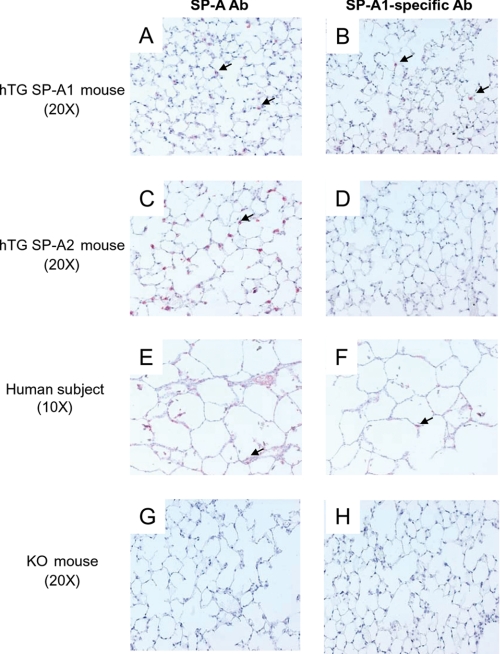
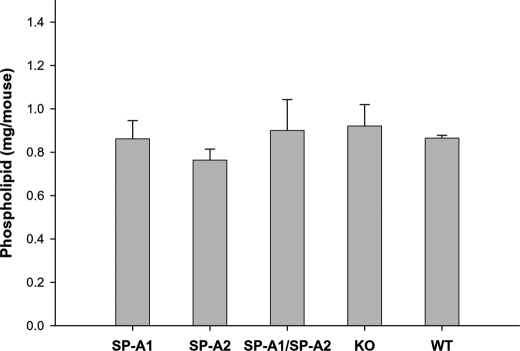
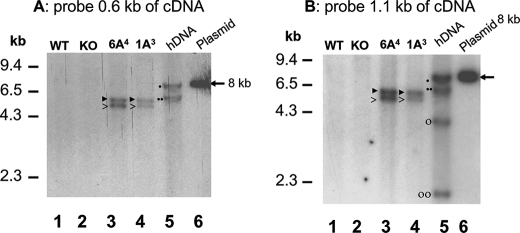
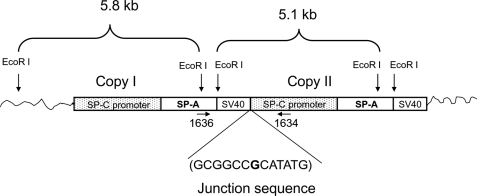
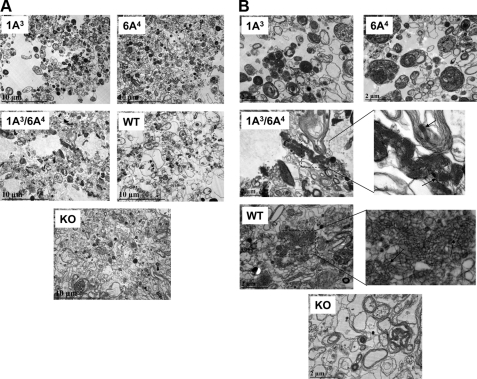
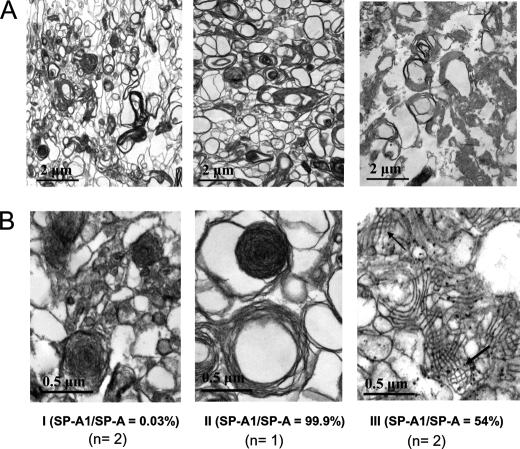
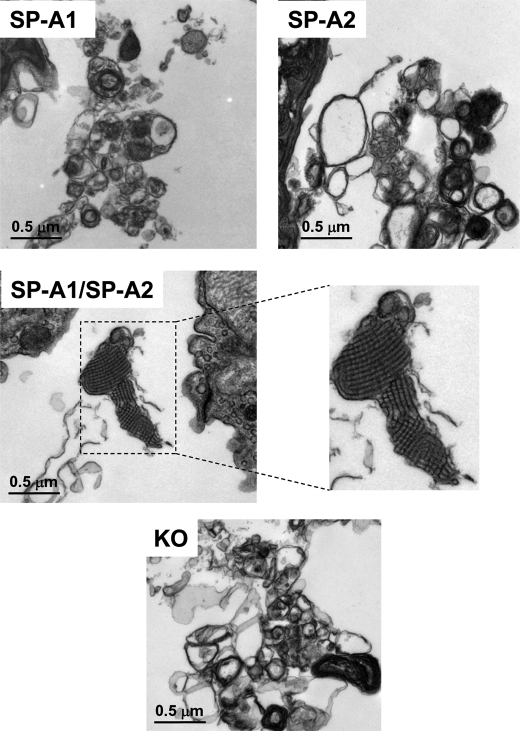
Surfactant protein A (SP-A) plays a role in lung innate immunity and surfactant-related functions. Two functional genes, SP-A1 (SFTPA1) and SP-A2 (SFTPA2), are present in humans and primates (rodents have one gene). Single gene SP-A1 or SP-A2 proteins expressed in vitro are functional. To study their role in vivo, we generated humanized transgenic (hTG) C57BL/6 mice, SP-A1(6A(4)) and SP-A2(1A(3)). The SP-A cDNA in experimental constructs was driven by the 3.7-kb SP-C promoter. Positive hTG mice were bred with SP-A knock-out mice to generate F8 offspring for study. Epithelial alveolar type II cells were SP-A-positive, and Clara cells were negative by immunohistochemistry in hTG mice. The levels of SP-A in lungs of two hTG lines used were comparable with those in human lungs. Southern blot analysis indicated that two cDNA copies of either SP-A1(6A(4)) or SP-A2(1A(3)) were integrated as a concatemer into the genome of each of the two hTG lines. Electron microscopy analysis revealed that hTG mice with a single SP-A1(6A(4)) or SP-A2(1A(3)) gene product lacked tubular myelin (TM), but hTG mice carrying both had TM. Furthermore, TM was observed in human bronchoalveolar lavage fluid only if both SP-A1 and SP-A2 gene products were present and not in those containing primarily (>99.7%) either SP-A1 or SP-A2 gene products. In vivo rescue study confirmed that TM can only be restored after administering exogenous SP-A containing both SP-A1 and SP-A2 into the lungs of SP-A knock-out mice. These observations indicate that SP-A1 and SP-A2 diverged functionally at least in terms of TM formation.


Figures

FIGURE 1.
FIGURE 1.
Construct of the recombinant DNA and identification of positive transgenic mice. A, diagrammatic representation of the recombinant DNA fragment used for the generation of hTG mice. The original vector (3.7-hSP-C/SV40) contained a fragment that included the 3.7 kb of the human SP-C promoter region and a 0.4-kb fragment of the SV40 poly(A) sequence. This vector has been used previously for foreign gene expression in alveolar epithelial type II cells in TG mice. The cDNA of human SP-A variants was first cloned into a pGEM vector, and prior to subcloning of the human SP-A cDNA into the SalI site of the 3.7-hSP-C/SV40 vector, two restriction sites (NotI and NdeI) within the coding region of the hSP-A cDNA were eliminated using site-directed mutagenesis (Stratagene, CA). A single nucleotide of the restriction enzyme recognition motif of either NotI or NdeI was changed, but the amino acid of SP-A was not changed. Then the 1.3-kb cDNA of hSP-A2(1A3) or SP-A1(6A4), containing a 0.1-kb 5′-UTR, the entire coding region of human SP-A (0.74-kb), and 0.5-kb of the 3′-UTR, was inserted into the SalI site of the 3.7hSP-C/SV40 vector. The 5.4-kb DNA fragment (3.7-kb SP-C promoter region, 1.3-kb cDNA of hSP-A, and the 0.4-kb SV40 poly-A terminator) was isolated and purified from the construct with both restriction enzymes NdeI and NotI. The pure DNA fragment was used for microinjection into fertilized C57BL/6 oocytes. B, identification of positive hTG mice by PCR. Positive hTG mice were identified using PCR with genomic DNA extracted from a tail fragment of potential hTG mice. The top section (I) of B shows the results from one representative experiment in which DNAs from 12 potential hTG mice along with the respective negative and positive control DNAs were analyzed. Positive hTG mice (lanes 6 and 10) exhibit a 1.4 kb band of PCR products with primer pair 1433 and 68, whereas the SP-A KO and WT mice lack this PCR band. M, DNA molecular marker; lanes 1–12 show 12 DNA samples from potential hTG mice; KO, SP-A KO mouse DNA; WT, wild-type mouse DNA; H2O, negative control for PCR (H2O was used instead of DNA template); plasmid, positive control for PCR (the plasmid used for positive control is the recombinant plasmid used for the generation of the hTG mouse). The bottom section (II) of B depicts a diagram of the transgene and location of primers used for PCR as well as the size of the PCR products. Primers 1433 (sense) and 68 (antisense) are located on the human SP-C promoter region and the human SP-A coding region, respectively.
FIGURE 2.
FIGURE 2.
Western blot analysis of surfactant protein expression in the lung of hTG mice. A, hSP-A expression in the lung of hTG mice. Total protein (100 μg/lane) from lung tissues of hTG mice and SP-A KO mice or BAL protein (15 μg per lane) from hTG mice were subjected to gel electrophoresis (10% SDS-PAGE for lung tissues and 4–20% gradient SDS-PAGE for BAL fluid) under reducing conditions. The protein in the gel was transferred onto a polyvinylidene difluoride membrane, and SP-A was detected using a rabbit antibody (IgG) to human SP-A at a 1:2000 dilution and then a goat anti-rabbit IgG (horseradish peroxidase-conjugated) antibody. The blot was exposed to XAR film following enhanced chemiluminescent detection. Lung tissues were prepared from the following mice: two SP-A KO (lanes 2 and 3), two SP-A2(1A3) hTG mice (lanes 4 and 5), and two SP-A1(6A4) hTG mice (lanes 6 and 7). BAL fluids were isolated from the hTG mice carrying a single human SP-A transgene, i.e. SP-A1(6A4) (lane 8), SP-A2(1A3) (lane 9), or both human SP-A1 and SP-A2 transgenes, SP-A2/SP-A1(1A3/6A4) (lane 10) and from the control KO mouse (lane 11). Two bands with nearly equal intensity were observed at the position of monomeric SP-A in the BAL from the hTG mice carrying human SP-A1 and SP-A2 transgenes (SP-A2/SP-A1(1A3/6A4) (lane 10)). The band with the slightly larger size is SP-A1 (marked by an asterisk), and the other is SP-A2 (marked by a filled circle). All hTG mice were generated in the SP-A KO background. Purified human SP-A protein (lane 1) used as positive control was from the BAL of an alveolar proteinosis patient. Monomer and dimer of SP-A are pointed out by arrows on the right. B, SP-B, SP-C, and SP-D expression in the lung of hTG mice. Total BAL proteins (15 μg/lane) from hTG mice and SP-A KO mice were subjected to gel electrophoresis (4–15% gradient SDS-PAGE) under reducing conditions. The protein in the gel was transferred onto a polyvinylidene difluoride membrane; SP-B, SP-C, and SP-D were detected by SP-B, SP-C, and SP-D antibody, respectively. The blot was exposed to XAR film following enhanced chemiluminescent detection. No significant differences were observed in the levels of each SP-B, SP-C, and SP-D among hTG mice and KO mice.
FIGURE 3.
FIGURE 3.
Oligomerization pattern of SP-A1 and SP-A2 in hTG mice as assessed by non-reducing immunoblot analysis. BAL fluid was prepared from hTG mice, SP-A2(1A3) and SP-A1(6A4), and then heated at 95 °C for 10 min in SDS-containing non-reducing buffer. About 15 μg of protein (per lane) was subjected to gel electrophoresis in a polyacrylamide gradient 4–15% gel under non-reducing conditions. The protein in the gel was transferred onto a polyvinylidene difluoride membrane, and SP-A bands on the membrane were detected using a primary rabbit antibody (IgG) to human SP-A and then a horseradish peroxidase-conjugated secondary antibody (goat anti-rabbit IgG). The blot was exposed to XAR film following enhanced ECL chemiluminescent detection. The oligomer pattern between SP-A1 and SP-A2 variants differed, as shown previously by in vitro expressed variants (29, 35). hSP-A protein from the BAL of an alveolar proteinosis patient was used as positive control. Molecular weight markers of protein sizes are shown on the left, and oligomeric forms are pointed out with arrows on the right.
FIGURE 4.
FIGURE 4.
Immunohistochemical analysis with hSP-A- and SP-A1-specific Abs. Lung tissues from each hTG mouse, SP-A1(6A4) and SP-A2(1A3), SP-A KO mouse, and a human subject were fixed with Bouin's solution (Sigma) for 24 h. About 5-μm thick sections were prepared from these fixed lung tissues. Immunohistochemical analysis using an ABC kit (Vector Laboratories, Inc., Burlingame CA) was performed with human SP-A Ab (A, C, E, and G) and an SP-A1-specific Ab (B, D, F, and H). The results indicate that the human SP-A Ab stains alveolar type II cells of all three types of lung tissues (A, C, and E), but the SP-A1-specific Ab detects alveolar type II cells only of lung tissues from the hTG SP-A1(6A4) mouse (B) and the human subject (F) but not from the SP-A2 mouse (D). As expected, no positive alveolar type II cells were detected in the lung of the SP-A KO mouse with either SP-A Ab (G) or SP-A1-specific Ab (H). The arrows point to positive type II cells.
FIGURE 5.
FIGURE 5.
Comparison of total phospholipids in the BAL fluid of hTG, KO, and WT mice. hTG mice (SP-A1(6A4), SP-A2(1A3), and SP-A1/SP-A2(6A4/1A3)), KO mice, and WT mice were killed, and the lung was lavaged three times, each time with 0.5 ml of saline buffer. The BAL was centrifuged at 150 × g to remove cells, and the supernatant was used for analysis. Each group contains five mice. The content of total phospholipids in the BAL fluid from each mouse was then determined by an in vitro phospholipids assay kit (Wako Diagnostics, Richmond, VA). The data were analyzed by a one-way analysis of variance test (significant differences were considered when p was <0.05). The results indicated no significant differences in the levels of total phospholipids of each group among hTG, KO, and WT mice.
FIGURE 6.
FIGURE 6.
Southern blot analysis of transgene integration in hTG mice. Genomic DNAs were prepared from hTG mice (SP-A1(6A4) and SP-A2(1A3)), SP-A KO mice, and WT mice as well as from human lung tissue. The DNA samples were digested with EcoRI. The digested DNAs were subjected to agarose-gel electrophoresis and then transferred to a nylon membrane. The hSP-A1 or hSP-A2 DNA bands were detected with 32P-labeled DNA probes of 0.6-kb or 1.1-kb fragments of human SP-A cDNA. The linearized plasmid DNA (about 8 kb, pointed out by an arrow) carrying the hSP-A cDNA (described in the legend to Fig. 1) was used as a control. After hybridization with either probe, the blot membrane was washed three times (see “Materials and Methods”) and then exposed to XAR film. A and B depict the RFLP pattern of hSP-A as detected by the 0.6- and 1.1-kb probes from SP-A cDNA, respectively. The 0.6-kb probe is located within the coding region (exons I–IV) of SP-A cDNA. This region contains no EcoRI cleavage site in either SP-A cDNA or human genomic DNA. The 1.1-kb probe contains the coding region (exons I–IV) and a partial 3′-UTR sequence (present in exon IV) of SP-A cDNA with one EcoRI cleavage site. This site is in the 3′-UTR of SP-A cDNA and human genomic DNA. The data from A indicate that there are two DNA bands (5.8 and 5.1 kb, marked by ▶ and >, respectively) in each of the hTG mice, SP-A1(6A4) and SP-A2(1A3). The human genomic DNA (hDNA) also shows two DNA bands (7.7 and 6.3 kb, marked by ● and ●●, respectively); the 6.3-kb fragment is from SP-A1, and the 7.7-kb fragment is from SP-A2. The RFLP pattern of B with the 1.1-kb probe shows that the hTG mice (SP-A1(6A4) and SP-A2(1A3)) also contained two DNA bands (5.8 and 5.1 kb, marked by ▶ and >, respectively), as shown in A. Human genomic DNA contains four bands. Of these, the 6.3 kb and 4.3 kb bands (marked by ●● and ○, respectively) are from SP-A1, and the 7.7 kb and 2.2 kb bands (marked by ● and ○○, respectively) are from SP-A2.
FIGURE 7.
FIGURE 7.
Analysis of concatemeric structure of the transgene and the junction sequence of transgenes in hTG mice. Southern blot analysis with either the 0.6-kb or the 1.1-kb probe indicated (as shown in Fig. 6) two DNA bands of about 5.8 and 5.1 kb in the hTG mice SP-A1(6A4) and SP-A2(1A3). These two bands are probably the result of a concatemer structure of the transgene. One 0.9-kb PCR DNA fragment could be generated with primers 1636 (sense) and 1634 (antisense) (data not shown). Because the sense primer 1636 is located in the 3′-UTR of the human SP-A gene and the antisense primer 1634 is on the flanking region of the human SP-C promoter, only a concatemer structure can produce the 0.9-kb PCR product. Sequencing analysis of the 0.9-kb PCR product revealed that two copies of the transgene form a concatemer structure. The junction sequence of the two copies of the transgene consists of a 3′-sequence (GCGGCC) of the first copy and a 5′-sequence (CATATG) of the second copy shown here. One additional base (G, shown in boldface type) was found between the two copies of the transgene.
FIGURE 8.
FIGURE 8.
Ultrastructures of surfactant large aggregates from BAL of hTG mice. BAL fluid was obtained from hTG mice with a single gene, either SP-A1(6A4) or SP-A2(1A3), and both genes SP-A1/SP-A2(6A4/1A3) as well as from the same background SP-A KO and WT mice. To generate a sufficient amount of the large aggregate fraction for this assay, BAL fluids from five mice were pooled for each type of samples. Large aggregates were prepared from BAL using sucrose gradient centrifugation. The large aggregate fraction of surfactant was collected from the interface following centrifugation. Pellets of large aggregates were fixed with 2.5% paraformaldehyde and 4% glutaraldehyde. After 24 h, the fixed pellets were used for analysis by electron microscopy. A and B represent ultrastructures of each sample at magnifications of ×10,000 (A) and ×30,000 (B), respectively. In the single gene-containing hTG mice, SP-A1(6A4) and SP-A2(1A3), the lamellar bodies in the large aggregates appear more dense compared with KO mice (A), and tubular myelin figures are absent compared with WT mice (B). hTG mice SP-A1/SP-A2(6A4/1A3) carrying both genes have a similar pattern of ultrastructures of large aggregates as WT mice, including formation of a significant amount of tubular myelin figures marked by arrows (B) in the enlargement of the 1A3/6A4 and WT.
FIGURE 9.
FIGURE 9.
Ultrastructures of surfactant large aggregates from BAL of human subjects. BAL fluid was obtained from human subjects where the ratio of SP-A1 to total SP-A was assessed in our previous work (25). Large aggregates of surfactant were prepared from BAL fluid of three types of individuals: with mostly SP-A2 protein present in the BAL fluid (i.e. SP-A1/SP-A = 0.003) (n = 2) (I); with mostly SP-A1 protein present in the BAL fluid (i.e. SP-A1/SP-A = 0.999) (n = 1) (II); and with both SP-A1 and SP-A2 present in the BAL fluid (n = 2) (III). Large aggregates were prepared from previously frozen BAL fluid using sucrose gradient centrifugation. The large aggregate fraction of surfactant was collected from the interface following centrifugation. Pellets of large aggregates were fixed with 2.5% paraformaldehyde and 4% glutaraldehyde. After 24 h, the fixed pellets were used for analysis by electron microscopy. A and B, ultrastructures of each sample at a magnification of ×10,000 (A) and ×30,000 (B), respectively. Tubular myelin figures were observed only in the samples containing both SP-A1 and SP-A2 gene products (III in B) and not in the ones containing either SP-A1 or SP-A2.
FIGURE 10.
FIGURE 10.
Ultrastructures of the lung tissues from in vivo TM rescue in SP-A KO mice. SP-A KO mice that lack TM structures were treated with exogenous SP-A protein. Fifty μl of saline buffer containing 2.5 or 5 μg of SP-A (one of the three types of SP-A (SP-A1, SP-A2, or SP-A1/SP-A2) described in the legend to Fig. 9) was administered into the lung of SP-KO mouse intratracheally. One negative control used 50 μl of saline without SP-A (see “Materials and Methods”). The mice were killed at 6 and 12 h after treatment, and the lung tissues were fixed immediately with Karnovsky's fixative solution for 24 h. The fixed lung tissues were used for analysis by electron microscopy. Ultrastructures of each sample (5 μg of SP-A and 6 h after treatment) were shown at a magnification of ×30,000. TM structures were observed in the lung tissues from the SP-A KO mice treated with SP-A containing both SP-A1 and SP-A2 gene products but not in those treated with SP-A1 or SP-A2 alone. As expected, no TM structure was found in the negative control.

Similar articles

Cited by

References

    1. Wright J. R. (2005) Nat. Rev. Immunol. 5, 58–68 - PubMed
    1. Bates S. R., Dodia C., Tao J. Q., Fisher A. B. (2008) Am. J. Physiol. Lung Cell Mol. Physiol. 294, L325–L333 - PubMed
    1. Korfhagen T. R., Bruno M. D., Ross G. F., Huelsman K. M., Ikegami M., Jobe A. H., Wert S. E., Stripp B. R., Morris R. E., Glasser S. W., Bachurski C. J., Iwamoto H. S., Whitsett J. A. (1996) Proc. Natl. Acad. Sci. U.S.A. 93, 9594–9599 - PMC - PubMed
    1. Ikegami M., Elhalwagi B. M., Palaniyar N., Dienger K., Korfhagen T., Whitsett J. A., McCormack F. X. (2001) J. Biol. Chem. 276, 38542–38548 - PubMed
    1. Jain D., Dodia C., Bates S. R., Hawgood S., Poulain F. R., Fisher A. B. (2003) Am. J. Physiol. Lung Cell Mol. Physiol. 284, L759–L765 - PubMed

Publication types

MeSH terms

Substances

LinkOut - more resources