. 2011 Mar;16(3):293-306.
doi: 10.1038/mp.2009.144. Epub 2010 Jan 5.

Differential effects of prenatal and postnatal expressions of mutant human DISC1 on neurobehavioral phenotypes in transgenic mice: evidence for neurodevelopmental origin of major psychiatric disorders

Affiliations
Free PMC article

Differential effects of prenatal and postnatal expressions of mutant human DISC1 on neurobehavioral phenotypes in transgenic mice: evidence for neurodevelopmental origin of major psychiatric disorders

Y Ayhan et al. Mol Psychiatry. 2011 Mar.
Free PMC article

Abstract

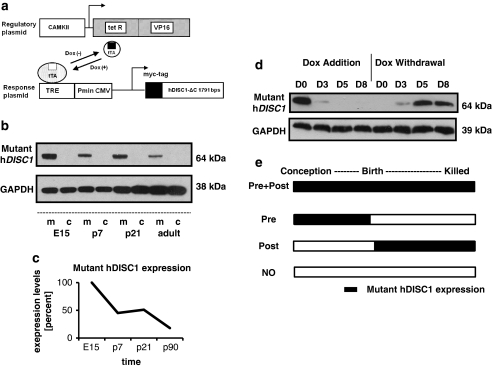
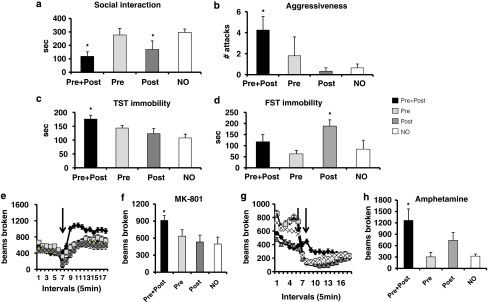
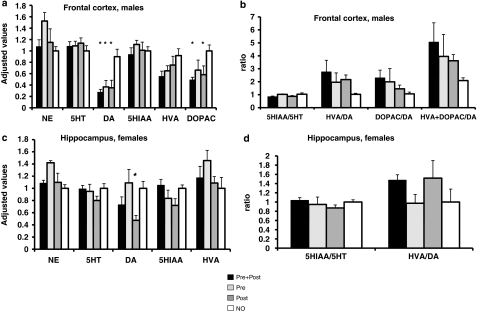
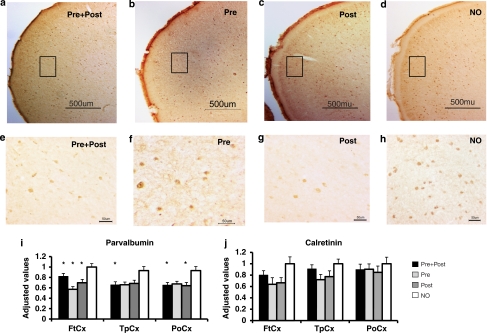
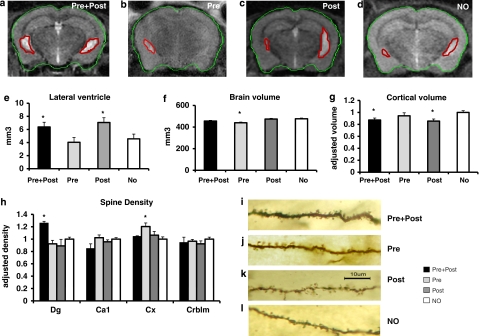
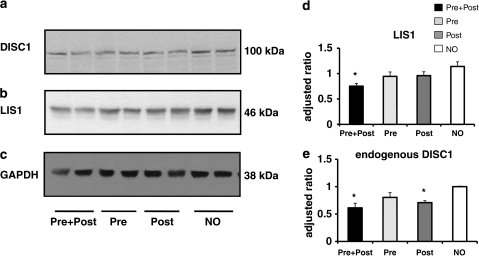
Strong genetic evidence implicates mutations and polymorphisms in the gene Disrupted-In-Schizophrenia-1 (DISC1) as risk factors for both schizophrenia and mood disorders. Recent studies have shown that DISC1 has important functions in both brain development and adult brain function. We have described earlier a transgenic mouse model of inducible expression of mutant human DISC1 (hDISC1) that acts in a dominant-negative manner to induce the marked neurobehavioral abnormalities. To gain insight into the roles of DISC1 at various stages of neurodevelopment, we examined the effects of mutant hDISC1 expressed during (1) only prenatal period, (2) only postnatal period, or (3) both periods. All periods of expression similarly led to decreased levels of cortical dopamine (DA) and fewer parvalbumin-positive neurons in the cortex. Combined prenatal and postnatal expression produced increased aggression and enhanced response to psychostimulants in male mice along with increased linear density of dendritic spines on neurons of the dentate gyrus of the hippocampus, and lower levels of endogenous DISC1 and LIS1. Prenatal expression only resulted in smaller brain volume, whereas selective postnatal expression gave rise to decreased social behavior in male mice and depression-like responses in female mice as well as enlarged lateral ventricles and decreased DA content in the hippocampus of female mice, and decreased level of endogenous DISC1. Our data show that mutant hDISC1 exerts differential effects on neurobehavioral phenotypes, depending on the stage of development at which the protein is expressed. The multiple and diverse abnormalities detected in mutant DISC1 mice are reminiscent of findings in major mental diseases.


Figures

Figure 1
Figure 1
Inducible expression of mutant hDISC1. (a) The scheme of the Tet-off system used to generate transgenic mice. (b, c) Expression of mutant hDISC1 in the cortex at embryonic day 15 (E15, PND 7 (p7), PND 21 (p21), and adulthood (adult) in double-transgenic mutant DISC1 mice (mutant) or single transgenic tTA mice (control). Mutant hDISC1 was visualized with anti-myc antibody (1:1000) and detected as a 64 kDa band. Anti-glyceraldehyde-3-phosphate dehydrogenase antibody (1:10000) was used as loading control. (d) Regulation of expression with Dox food. Adding Dox food to or withdrawing it from mouse diet resulted in shutting down or restoring, respectively, expression of mutant hDISC1 within 5–7 days; day 0—the positive control sample before adding (expression) or before withdrawing (no expression) Dox food. (e) The experimental groups used in the study. The Pre+Post group had no exposure to the Dox food and expressed mutant hDISC1 during prenatal and postnatal periods; the Pre group was given Dox after E17 and expressed mutant hDISC1 during the prenatal period only; the Post group was given Dox until E12 and expressed mutant hDISC1 during the postnatal period only; the NO group was given Dox food all the time and had no expression of mutant hDISC1 throughout the entire life. GAPDH, glyceraldehyde-3-phosphate dehydrogenase.
Figure 2
Figure 2
Time-dependent behavioral effects of mutant hDISC1. (a) Decreased non-aggressive social interaction in the Pre+Post and Post groups compared with the NO group, *denotes P<0.05 vs the NO group; n=7–8 male mice per group. (b) Aggressive attacks in mice. Note significantly more attacks in the Pre+Post group compared to the NO group, *denotes P<0.05 vs the NO group, n=7–8 male mice per group. (c) Time of immobility in tail suspension test (TST). Note increased time of immobility in mice of the Pre+Post group compared to the NO group, *denotes P<0.05 vs the NO group; n=6 female mice per group. (d) Time of immobility in forced swim test (FST). Note increased time of immobility in the Post group compared to the NO group, *denotes P<0.05 vs the NO group, n=6 female mice per group. (e) MK-801-induced locomotor activity. Note greater drug-induced activity in the Pre+Post group compared to other groups, n=8–12 male mice per group; the arrow points to the time of injection. (f) The effect of MK-801 on the total activity over one hour. The mean values of total locomotor activity over 1 h are presented. Note the significantly increased locomotor activity in the Pre+Post group compared to the NO group, *denotes P<0.05 vs the NO group. (g) -amphetamine-induced locomotor activity. Note significantly increased activity in the Pre+Post group compared to other groups, n=6–8 male mice per group; the arrow points to the time of injection. (h) The effect of amphetamine injection on total locomotor activity during the first 15 min post injection. The mean values of total locomotor activity over 15 min are presented. Note greater drug-induced activity in the Pre+Post group vs other groups, *denotes P<0.05 vs the NO or Pre groups.
Figure 3
Figure 3
Regional alterations in levels of monoamines. (a) A significant decrease in tissue content of dopamine (DA) and 3,4 dihydroxy-phenylacetic acid (DOPAC) in cortex of male mice of either group compared to male mice of the NO group, *denotes P<0.05 vs the NO group, n=5–6. (b) No significant changes in monoamine turnover in frontal cortex of male mice. (c) Tissue content of DA was significantly decreased in the hippocampus of female mice of the Post group compared to female mice of the Pre or NO groups, *denotes P<0.05 vs the Pre or NO groups, n=4–6. (d) No significant changes in monoamine turnover in the hippocampus of female mice.
Figure 4
Figure 4
Decreased numbers of parvalbumin (PV)-positive interneurons in mutant DISC1 transgenic mice. PV-positive cells in frontal cortical areas of the Pre+Post (a, e), Pre (b, f), Post (c, g), and NO (d, h) groups; ‘ad' panels are low magnification images, scale bar, 500 μm; ‘eh' panels are high magnification images, scale bar, 50 μm. A quantitative analysis showed a significant decrease in numbers of PV-positive cells throughout the entire cortex in the Pre+Post, Pre, and Post groups compared to the NO group (i). The significant decrease was found in fronto-temporal (Ftcx), temporo-parietal (Tpcx), and parieto-occipital (Pocx) cortices; n=4–6 mice per group, *denotes P<0.05 vs the NO group. No significant changes in numbers of calretinin (CR)-positive cells were found, n=4–6 mice per group (j).
Figure 5
Figure 5
Morphometric analyses of the effects of mutant hDISC1. (ad) Representative magnetic resonance imaging coronal images for the Pre+Post (a), Pre (b), Post (c), and NO (d) groups. The boundaries of the brain and the lateral ventricles are outlined. (e) The significantly increased volumes of the lateral ventricles in the Pre+Post and the Post group compared to the NO group, n=8 mice per group, *denotes P<0.05 vs the NO group. (f) The significantly decreased total brain volumes in the Pre group compared to the Post or the NO groups, n=8 mice per group, *denotes P<0.05 vs the Post or NO groups. (g) The significantly decreased cortical volumes in the Pre+Post and Post groups compared to the NO group, n=8 mice per group, *denotes P<0.05 vs the NO group. (h) A quantitative analyses of the linear spine density on dendrites of granule cells of the dentate gyrus (Dg), CA1area (Ca1) of the hippocampus, pyramidal neurons of the temporal cortical area (Cx), and the Purkinje cells of the cerebellum (Crblm); *denotes P<0.05 vs the other groups; #denotes P<0.05 vs the NO group; n=10–20 neurons per mouse, four mice per group; representative images of dendritic spines from the Pre+Post (i), Pre (j) and Post (k), and NO (l) groups, scale bar, 10 μm.
Figure 6
Figure 6
Expression of endogenous DISC1 and LIS1. (ac) Representative blots for endogenous DISC1 (a), LIS1 (b), and glyceraldehyde-3-phosphate dehydrogenase (GAPDH) (c), cortical samples collected at P7. (d) The significantly decreased levels of LIS1 in the Pre+Post group compared to the NO group, n=4–5 samples per group, *denotes P<0.05 vs the NO group. (e) The significantly decreased levels of endogenous DISC1 in the Pre+Post and Post group vs the NO group, n=4–5 samples per group, *denotes P<0.05 vs the NO group.

Similar articles

Cited by

References

    1. European Network of Schizophrenia Networks for the Study of Gene-Environment Interactions Leboyer M, Meyer-Lindenberg A, Stefanis N, Rutten BP, Arango C, Jones P, et al. Schizophrenia aetiology: do gene-environment interactions hold the key. Schizophr Res. 2008;102:21–26. - PubMed
    1. Sanches M, Keshavan MS, Brambilla P, Soares JC. Neurodevelopmental basis of bipolar disorder: a critical appraisal. Prog Neuropsychopharmacol Biol Psychiatry. 2008;32:1617–1627. - PubMed
    1. Eastwood SL. The synaptic pathology of schizophrenia: is aberrant neurodevelopment and plasticity to blame. Int Rev Neurobiol. 2004;59:47–72. - PubMed
    1. Keshavan MSGAR, Diwadkar VA.Neurodevelopmental theoriesIn: Lieberman JA STS, Perkins DO (eds). The American Psychiatric Publishing Textbook of Schizophrenia The American Psychiatric Publishing: Arlington, VA; 200666–84.
    1. Ross CA, Margolis RL, Reading SA, Pletnikov M, Coyle JT. Neurobiology of schizophrenia. Neuron. 2006;52:139–153. - PubMed

Publication types

MeSH terms