

Spatial modeling of PM10 and NO2 in the continental United States, 1985-2000
- PMID: 20049118
- PMCID: PMC2801201
- DOI: 10.1289/ehp.0900840
Spatial modeling of PM10 and NO2 in the continental United States, 1985-2000
Abstract
Background: Epidemiologic studies of air pollution have demonstrated a link between long-term air pollution exposures and mortality. However, many have been limited to city-specific average pollution measures or spatial or land-use regression exposure models in small geographic areas.
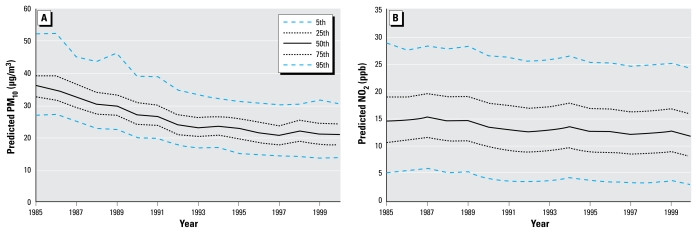
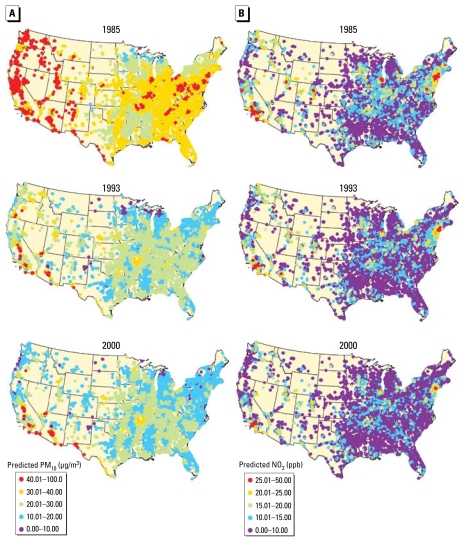
Objectives: Our objective was to develop nationwide models of annual exposure to particulate matter < 10 microm in diameter (PM(10)) and nitrogen dioxide during 1985-2000.
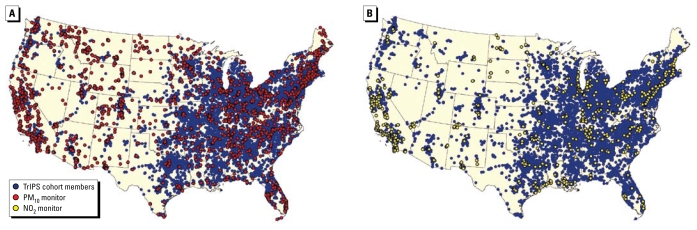
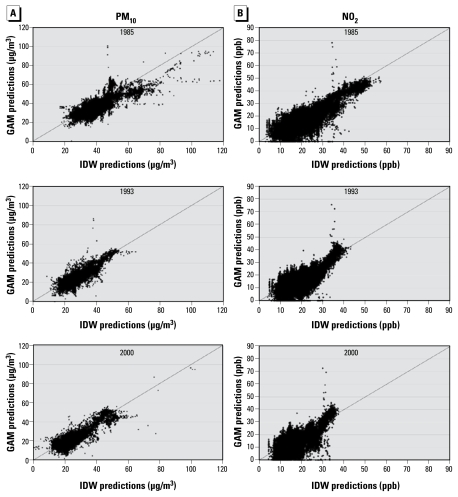
Methods: We used generalized additive models (GAMs) to predict annual levels of the pollutants using smooth spatial surfaces of available monitoring data and geographic information system-derived covariates. Model performance was determined using a cross-validation (CV) procedure with 10% of the data. We also compared the results of these models with a commonly used spatial interpolation, inverse distance weighting.
Results: For PM(10), distance to road, elevation, proportion of low-intensity residential, high-intensity residential, and industrial, commercial, or transportation land use within 1 km were all statistically significant predictors of measured PM(10) (model R(2) = 0.49, CV R(2) = 0.55). Distance to road, population density, elevation, land use, and distance to and emissions of the nearest nitrogen oxides-emitting power plant were all statistically significant predictors of measured NO(2) (model R(2) = 0.88, CV R(2) = 0.90). The GAMs performed better overall than the inverse distance models, with higher CV R(2) and higher precision.
Conclusions: These models provide reasonably accurate and unbiased estimates of annual exposures for PM(10) and NO(2). This approach provides the spatial and temporal variability necessary to describe exposure in studies assessing the health effects of chronic air pollution.
Keywords: GIS; nitrogen dioxide; outdoor air pollution; particulate matter.
Figures
Similar articles
-
Evaluating heterogeneity in indoor and outdoor air pollution using land-use regression and constrained factor analysis.Res Rep Health Eff Inst. 2010 Dec;(152):5-80; discussion 81-91. Res Rep Health Eff Inst. 2010. PMID: 21409949
-
The London low emission zone baseline study.Res Rep Health Eff Inst. 2011 Nov;(163):3-79. Res Rep Health Eff Inst. 2011. PMID: 22315924
-
The impact of the congestion charging scheme on air quality in London. Part 1. Emissions modeling and analysis of air pollution measurements.Res Rep Health Eff Inst. 2011 Apr;(155):5-71. Res Rep Health Eff Inst. 2011. PMID: 21830496
-
Methods for Assessing Long-Term Exposures to Outdoor Air Pollutants.Curr Environ Health Rep. 2017 Dec;4(4):450-462. doi: 10.1007/s40572-017-0169-5. Curr Environ Health Rep. 2017. PMID: 29064065 Free PMC article. Review.
-
Assessing Adverse Health Effects of Long-Term Exposure to Low Levels of Ambient Air Pollution: Implementation of Causal Inference Methods.Res Rep Health Eff Inst. 2022 Jan;2022(211):1-56. Res Rep Health Eff Inst. 2022. PMID: 36193708 Free PMC article. Review.
Cited by
-
Use of generalized additive models and cokriging of spatial residuals to improve land-use regression estimates of nitrogen oxides in Southern California.Atmos Environ (1994). 2012 Aug 1;55:220-228. doi: 10.1016/j.atmosenv.2012.03.035. Atmos Environ (1994). 2012. PMID: 23439926 Free PMC article.
-
Long-term ambient multipollutant exposures and mortality.Am J Respir Crit Care Med. 2011 Jan 1;183(1):73-8. doi: 10.1164/rccm.200912-1903OC. Epub 2010 Jul 23. Am J Respir Crit Care Med. 2011. PMID: 20656944 Free PMC article.
-
Air pollution exposures during adulthood and risk of endometriosis in the Nurses' Health Study II.Environ Health Perspect. 2014 Jan;122(1):58-64. doi: 10.1289/ehp.1306627. Epub 2013 Nov 13. Environ Health Perspect. 2014. PMID: 24225723 Free PMC article.
-
Ambient air pollution exposures and risk of rheumatoid arthritis.Arthritis Care Res (Hoboken). 2013 Jul;65(7):1190-6. doi: 10.1002/acr.21975. Arthritis Care Res (Hoboken). 2013. PMID: 23401426 Free PMC article.
-
Spatio-Temporal Variation-Induced Group Disparity of Intra-Urban NO2 Exposure.Int J Environ Res Public Health. 2022 May 12;19(10):5872. doi: 10.3390/ijerph19105872. Int J Environ Res Public Health. 2022. PMID: 35627409 Free PMC article.
References
-
- Adar SD, Kaufman JD. Cardiovascular disease and air pollutants: evaluating and improving epidemiological data implicating traffic exposure. Inhal Toxicol. 2007;19(suppl 1):135–149. - PubMed
-
- Bayer-Oglesby L, Schindler C, Hazenkamp-von Arx ME, Braun-Fahrlander C, Keidel D, Rapp R, et al. Living near main streets and respiratory symptoms in adults: the Swiss Cohort Study on Air Pollution and Lung Diseases in Adults. Am J Epidemiol. 2006;164(12):1190–1198. - PubMed
-
- Beelen R, Hoek G, Pebesma E, Vienneau D, de Hoogh K, Briggs DJ. Mapping of background air pollution at a fine spatial scale across the European Union. Sci Total Environ. 2009;407(6):1852–1867. - PubMed
-
- Brauer M, Hoek G, van Vliet P, Meliefste K, Fischer P, Gehring U, et al. Estimating long-term average particulate air pollution concentrations: application of traffic indicators and geographic information systems. Epidemiology. 2003;14(2):228–239. - PubMed
-
- Briggs DJ, Collins S, Elliott P, Fischer P, Kingham S, Lebret E. Mapping urban air pollution GIS: a regression-based approach. Int J Geogr Inf Sci. 1997;11(7):699–718.
Publication types
MeSH terms
Substances
Grants and funding
LinkOut - more resources
Full Text Sources
Medical
