

Mapping community determinants of heat vulnerability
- PMID: 20049125
- PMCID: PMC2801183
- DOI: 10.1289/ehp.0900683
Mapping community determinants of heat vulnerability
Abstract
Background: The evidence that heat waves can result in both increased deaths and illness is substantial, and concern over this issue is rising because of climate change. Adverse health impacts from heat waves can be avoided, and epidemiologic studies have identified specific population and community characteristics that mark vulnerability to heat waves.
Objectives: We situated vulnerability to heat in geographic space and identified potential areas for intervention and further research.
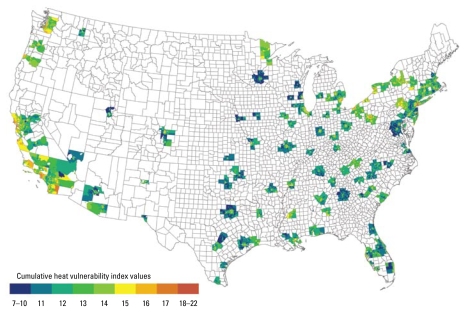
Methods: We mapped and analyzed 10 vulnerability factors for heat-related morbidity/mortality in the United States: six demographic characteristics and two household air conditioning variables from the U.S. Census Bureau, vegetation cover from satellite images, and diabetes prevalence from a national survey. We performed a factor analysis of these 10 variables and assigned values of increasing vulnerability for the four resulting factors to each of 39,794 census tracts. We added the four factor scores to obtain a cumulative heat vulnerability index value.
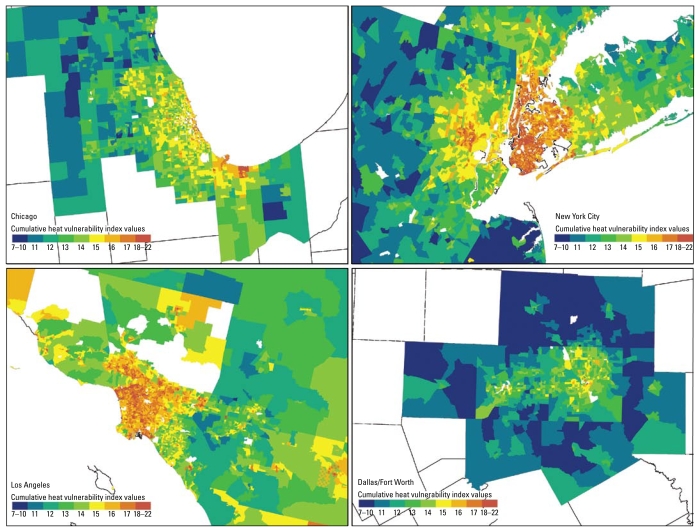
Results: Four factors explained > 75% of the total variance in the original 10 vulnerability variables: a) social/environmental vulnerability (combined education/poverty/race/green space), b) social isolation, c) air conditioning prevalence, and d) proportion elderly/diabetes. We found substantial spatial variability of heat vulnerability nationally, with generally higher vulnerability in the Northeast and Pacific Coast and the lowest in the Southeast. In urban areas, inner cities showed the highest vulnerability to heat.
Conclusions: These methods provide a template for making local and regional heat vulnerability maps. After validation using health outcome data, interventions can be targeted at the most vulnerable populations.
Keywords: climate; environmental health; geographic information systems; heat; public health; vulnerable populations.
Figures
Similar articles
-
Development of a heat vulnerability index for New York State.Public Health. 2018 Aug;161:127-137. doi: 10.1016/j.puhe.2017.09.006. Epub 2017 Dec 1. Public Health. 2018. PMID: 29195682
-
Predicting hospitalization for heat-related illness at the census-tract level: accuracy of a generic heat vulnerability index in Phoenix, Arizona (USA).Environ Health Perspect. 2015 Jun;123(6):606-12. doi: 10.1289/ehp.1307868. Epub 2015 Jan 30. Environ Health Perspect. 2015. PMID: 25635952 Free PMC article.
-
Geographic dimensions of heat-related mortality in seven U.S. cities.Environ Res. 2015 Apr;138:439-52. doi: 10.1016/j.envres.2015.02.033. Epub 2015 Mar 17. Environ Res. 2015. PMID: 25791867
-
Minimization of heatwave morbidity and mortality.Am J Prev Med. 2013 Mar;44(3):274-82. doi: 10.1016/j.amepre.2012.11.015. Am J Prev Med. 2013. PMID: 23415125 Review.
-
Heat stress and public health: a critical review.Annu Rev Public Health. 2008;29:41-55. doi: 10.1146/annurev.publhealth.29.020907.090843. Annu Rev Public Health. 2008. PMID: 18031221 Review.
Cited by
-
Neighborhood effects on heat deaths: social and environmental predictors of vulnerability in Maricopa County, Arizona.Environ Health Perspect. 2013 Feb;121(2):197-204. doi: 10.1289/ehp.1104625. Epub 2012 Nov 16. Environ Health Perspect. 2013. PMID: 23164621 Free PMC article.
-
Excess Mortality in Istanbul during Extreme Heat Waves between 2013 and 2017.Int J Environ Res Public Health. 2019 Nov 7;16(22):4348. doi: 10.3390/ijerph16224348. Int J Environ Res Public Health. 2019. PMID: 31703402 Free PMC article.
-
An Approach to Developing Local Climate Change Environmental Public Health Indicators in a Rural District.J Environ Public Health. 2017;2017:3407325. doi: 10.1155/2017/3407325. Epub 2017 Mar 2. J Environ Public Health. 2017. PMID: 28352286 Free PMC article. Review.
-
Impacts of extreme heat on emergency medical service calls in King County, Washington, 2007-2012: relative risk and time series analyses of basic and advanced life support.Environ Health. 2016 Jan 28;15:13. doi: 10.1186/s12940-016-0109-0. Environ Health. 2016. PMID: 26823080 Free PMC article.
-
Managing health impacts of heat in South East Queensland, Australia.Disaster Health. 2014 Oct 30;2(2):82-91. doi: 10.4161/2167549X.2014.960717. eCollection 2014 Apr-Jun. Disaster Health. 2014. PMID: 28229002 Free PMC article.
References
-
- Basu R, Feng WY, Ostro BD. Characterizing temperature and mortality in nine California counties. Epidemiology. 2008;19(1):138–145. - PubMed
-
- Basu R, Ostro BD. A multicounty analysis identifying the populations vulnerable to mortality associated with high ambient temperature in California. Am J Epidemiol. 2008;168(6):632–637. - PubMed
-
- Braga AL, Zanobetti A, Schwartz J. The time course of weather-related deaths. Epidemiology. 2001;12(6):662–667. - PubMed
-
- CDC (Centers for Disease Control and Prevention) Heat-related deaths—Los Angeles County, California, 1999–2000, and United States, 1979–1998. JAMA. 2001;286(8):911–912. - PubMed
Publication types
MeSH terms
LinkOut - more resources
Full Text Sources
Medical
