Differential impact of tumor suppressor pathways on DNA damage response and therapy-induced transformation in a mouse primary cell model
- PMID: 20049321
- PMCID: PMC2796719
- DOI: 10.1371/journal.pone.0008558
Differential impact of tumor suppressor pathways on DNA damage response and therapy-induced transformation in a mouse primary cell model
Abstract
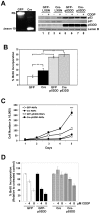
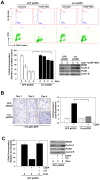
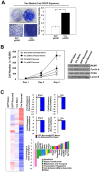
The RB and p53 tumor suppressors are mediators of DNA damage response, and compound inactivation of RB and p53 is a common occurrence in human cancers. Surprisingly, their cooperation in DNA damage signaling in relation to tumorigenesis and therapeutic response remains enigmatic. In the context of individuals with heritable retinoblastoma, there is a predilection for secondary tumor development, which has been associated with the use of radiation-therapy to treat the primary tumor. Furthermore, while germline mutations of the p53 gene are critical drivers for cancer predisposition syndromes, it is postulated that extrinsic stresses play a major role in promoting varying tumor spectrums and disease severities. In light of these studies, we examined the tumor suppressor functions of these proteins when challenged by exposure to therapeutic stress. To examine the cooperation of RB and p53 in tumorigenesis, and in response to therapy-induced DNA damage, a combination of genetic deletion and dominant negative strategies was employed. Results indicate that loss/inactivation of RB and p53 is not sufficient for cellular transformation. However, these proteins played distinct roles in response to therapy-induced DNA damage and subsequent tumorigenesis. Specifically, RB status was critical for cellular response to damage and senescence, irrespective of p53 function. Loss of RB resulted in a dramatic evolution of gene expression as a result of alterations in epigenetic programming. Critically, the observed changes in gene expression have been specifically associated with tumorigenesis, and RB-deficient, recurred cells displayed oncogenic characteristics, as well as increased resistance to subsequent challenge with discrete therapeutic agents. Taken together, these findings indicate that tumor suppressor functions of RB and p53 are particularly manifest when challenged by cellular stress. In the face of such challenge, RB is a critical suppressor of tumorigenesis beyond p53, and RB-deficiency could promote significant cellular evolution, ultimately contributing to a more aggressive disease.
Conflict of interest statement
Figures


Similar articles
-
RB and p53 cooperate to prevent liver tumorigenesis in response to tissue damage.Gastroenterology. 2011 Oct;141(4):1439-50. doi: 10.1053/j.gastro.2011.06.046. Epub 2011 Jun 24. Gastroenterology. 2011. PMID: 21704587 Free PMC article.
-
Inactivation of multiple tumor-suppressor genes involved in negative regulation of the cell cycle, MTS1/p16INK4A/CDKN2, MTS2/p15INK4B, p53, and Rb genes in primary lymphoid malignancies.Blood. 1996 Jun 15;87(12):4949-58. Blood. 1996. PMID: 8652807
-
A systematic search for downstream mediators of tumor suppressor function of p53 reveals a major role of BTG2 in suppression of Ras-induced transformation.Genes Dev. 2006 Jan 15;20(2):236-52. doi: 10.1101/gad.1372606. Genes Dev. 2006. PMID: 16418486 Free PMC article.
-
Genetic instability as a consequence of inappropriate entry into and progression through S-phase.Cancer Metastasis Rev. 1995 Mar;14(1):59-73. doi: 10.1007/BF00690212. Cancer Metastasis Rev. 1995. PMID: 7606822 Review.
-
Murine models of neoplasia: functional analysis of the tumour suppressor genes Rb-1 and p53.Cancer Metastasis Rev. 1995 Jun;14(2):125-48. doi: 10.1007/BF00665796. Cancer Metastasis Rev. 1995. PMID: 7554030 Review.
Cited by
-
CDK4/6 inhibition antagonizes the cytotoxic response to anthracycline therapy.Cell Cycle. 2012 Jul 15;11(14):2747-55. doi: 10.4161/cc.21127. Epub 2012 Jul 15. Cell Cycle. 2012. PMID: 22751436 Free PMC article.
-
Therapeutically activating RB: reestablishing cell cycle control in endocrine therapy-resistant breast cancer.Endocr Relat Cancer. 2011 Apr 28;18(3):333-45. doi: 10.1530/ERC-10-0262. Print 2011 Jun. Endocr Relat Cancer. 2011. PMID: 21367843 Free PMC article.
References
-
- Wogan GN, Hecht SS, Felton JS, Conney AH, Loeb LA. Environmental and chemical carcinogenesis. Semin Cancer Biol. 2004;14:473–486. - PubMed
-
- Herceg Z. Epigenetics and cancer: towards an evaluation of the impact of environmental and dietary factors. Mutagenesis. 2007;22:91–103. - PubMed
-
- Farazi PA, DePinho RA. Hepatocellular carcinoma pathogenesis: from genes to environment. Nat Rev Cancer. 2006;6:674–687. - PubMed
-
- Matsumura Y, Ananthaswamy HN. Toxic effects of ultraviolet radiation on the skin. Toxicol Appl Pharmacol. 2004;195:298–308. - PubMed
Publication types
MeSH terms
Substances
Grants and funding
LinkOut - more resources
Full Text Sources
Research Materials
Miscellaneous

