. 2010 Jan 1;5(1):e8556.
doi: 10.1371/journal.pone.0008556.

LDLR expression and localization are altered in mouse and human cell culture models of Alzheimer's disease

Affiliations

LDLR expression and localization are altered in mouse and human cell culture models of Alzheimer's disease

Jose F Abisambra et al. PLoS One. .

Abstract

Background: Alzheimer's disease (AD) is a chronic neurodegenerative disorder and the most common form of dementia. The major molecular risk factor for late-onset AD is expression of the epsilon-4 allele of apolipoprotein E (apoE), the major cholesterol transporter in the brain. The low-density lipoprotein receptor (LDLR) has the highest affinity for apoE and plays an important role in brain cholesterol metabolism.

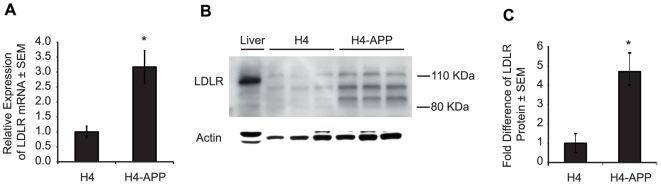
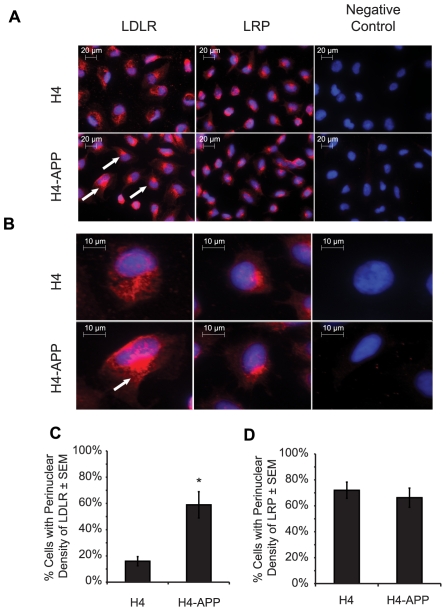
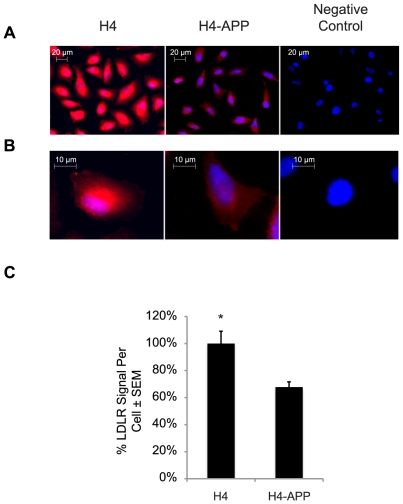
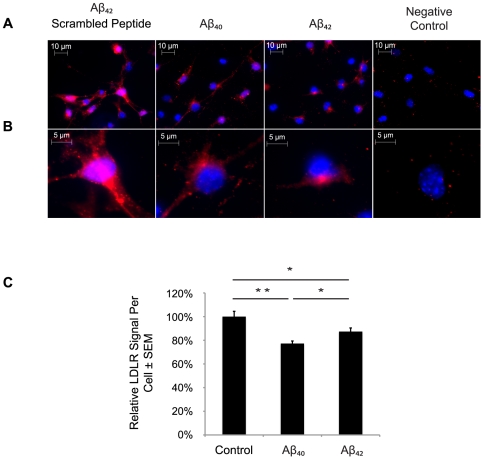
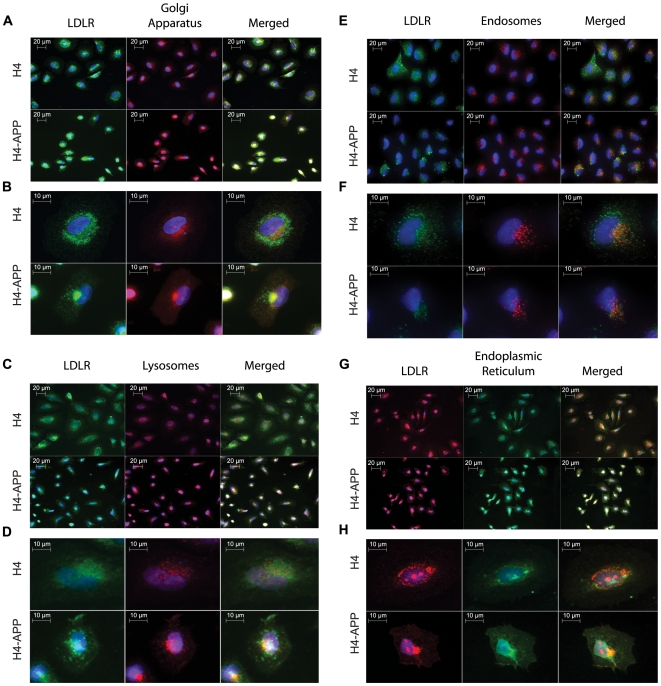
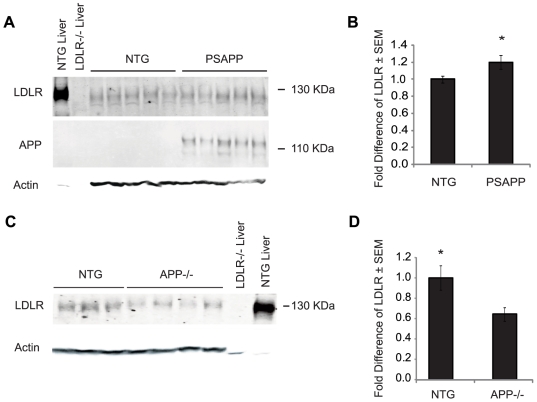
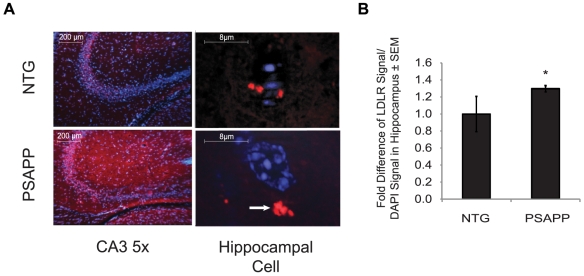
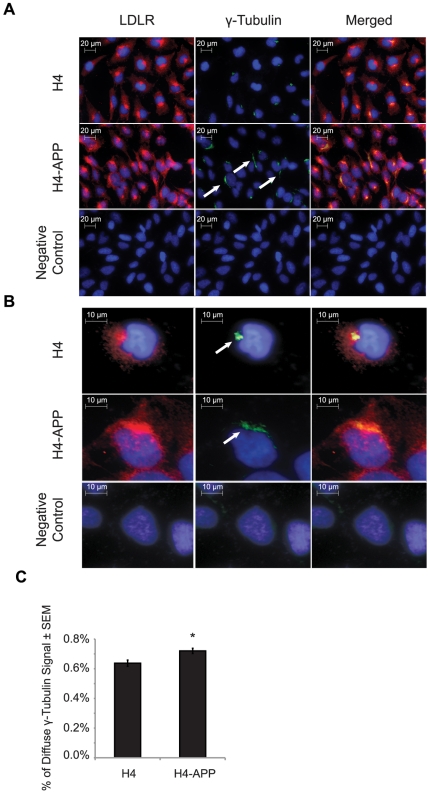
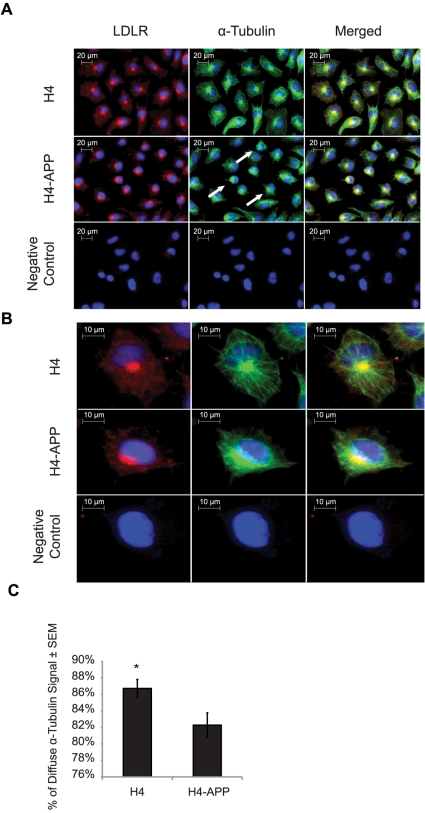
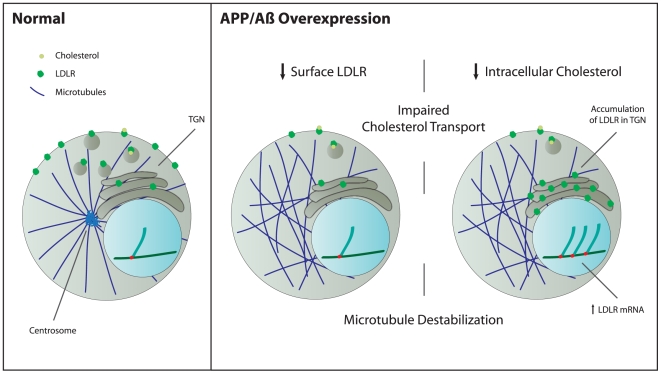
Methodology/principal findings: Using RT-PCR and western blotting techniques we found that over-expression of APP caused increases in both LDLR mRNA and protein levels in APP transfected H4 neuroglioma cells compared to H4 controls. Furthermore, immunohistochemical experiments showed aberrant localization of LDLR in H4-APP neuroglioma cells, Abeta-treated primary neurons, and in the PSAPP transgenic mouse model of AD. Finally, immunofluorescent staining of LDLR and of gamma- and alpha-tubulin showed a change in LDLR localization preferentially away from the plasma membrane that was paralleled by and likely the result of a disruption of the microtubule-organizing center and associated microtubule network.

Conclusions/significance: These data suggest that increased APP expression and Abeta exposure alters microtubule function, leading to reduced transport of LDLR to the plasma membrane. Consequent deleterious effects on apoE uptake and function will have implications for AD pathogenesis and/or progression.


Conflict of interest statement

Competing Interests: The authors have declared that no competing interests exist.

Figures

Figure 1
Figure 1. LDLR mRNA and protein are upregulated in H4-APP cells compared to H4 controls.
(A) RT-PCR quantification of LDLR mRNA expression level in H4 and H4-APP cells (n = 3; *p = 0.04). LDLR threshold cycle values were normalized to GAPDH. (B) Western blot for LDLR in whole-cell lysates from H4 and H4-APP cells. Lane 1 contains liver whole-cell lysate from a NTG mouse. (C) Quantification of western blot (n = 3; *p = 0.01). All bands for LDLR were quantified and their values shown in this graph. The LDLR band densities were normalized to the actin band in each lane. RT-PCR and western blot experiments were conducted in triplicate.
Figure 2
Figure 2. LDLR distribution is altered in H4-APP cells compared to H4 controls.
(A) Immunohistochemistry imaging at 400× magnification of LDLR and LRP in H4 and H4-APP cells. Red signal corresponds to LDLR or LRP as indicated and blue signal corresponds to Hoechst-labeled cell nuclei. Arrowheads point to three examples of a dense perinuclear LDLR-positive signal present in H4-APP cells. (B) Larger image of a selected cell from panel 2A; the arrowhead points to an LDLR-positive density. (C and D) Quantification of the percentage of cells with perinuclear density of fluorescent signal in LDLR (C) and LRP (D), which is described in more detail in Figure S2.
Figure 3
Figure 3. Cell surface LDLR is much reduced in H4-APP cells.
H4 and H4-APP cells were immunostained for LDLR in the absence of detergents to prevent permeabilization of the plasma membrane and allow antibody access only to the cell surface. (A) Images magnified at 400× showing LDLR signal (red) and nuclei (blue) for H4 and H4-APP. (B) Zoomed image of one cell isolated from panel A. (C) Quantification of the average LDLR-positive signal per cell showing a 32% reduction of LDLR on the membrane of H4-APP cells (*p = 0.03). The average of the ratio of the total LDLR intensity and the number of cell nuclei for the H4 condition was equaled to 100%. The H4-APP ratio was divided by the H4 ratio of LDLR intensity per cell; A total of ∼18,000 cells were taken into account from three independent experiments.
Figure 4
Figure 4. Aβ42 reduces LDLR cell surface localization in primary neurons of NTG mice.
Primary neurons were obtained from E18 fetuses, plated and grown for one week, and treated with 1 µM Aβ40 or Aβ42 for 48 hours. Cell surface LDLR was immunostained (red). (A) Image of primary neurons from cells treated for 48 hours with 1µM Aβ42 scrambled peptide, Aβ40, and Aβ42; image is magnified 630×. (B) Zoomed image isolating one cell in each field of panel A. The negative control corresponds to staining in the absence of primary antibody. Quantification as in Figure 3 revealed statistically significant reduction in cell surface LDLR induced by exposure to Aβ.
Figure 5
Figure 5. LDLR is abundant in the trans-Golgi network of H4-APP cells.
H4 and H4-APP cells were co-stained for LDLR and different organelle markers. A and B show Golgi apparatus at low and high magnification, respectively. C and D show LDLR co-stained with lysosomal marker at low and high magnification, respectively. E and F show LDLR co-stained for endosomes at low and high magnification respectively. G and H show LDLR co-stained with endoplasmic reticulum at low and high magnification, respectively. A, C, E, and G were taken at 400×, while B, D, F, and H are zoomed images.
Figure 6
Figure 6. Brain LDLR is increased in PSAPP mice and decreased in APP−/− mice compared to controls.
Whole-cell lysates were prepared from brains of 10-month old PSAPP, APP−/−, and age-matched non-transgenic control mice for western blot analyses; liver whole cell lysates were prepared from NTG and LDLR−/− as positive and negative control homogenates, respectively. (A) Western blot for LDLR, APP, and actin from PSAPP and NTG control lysates. (B) Quantification of LDLR signal normalized to actin in western blot of panel A (n = 5; *p = 0.05). (C) Western blot for LDLR and actin from NTG and APP−/− mice. (D) Quantification of LDLR signal normalized to actin in western blot of panel C (nNTG = 3 and nAPP−/− = 4; *p = 0.04).
Figure 7
Figure 7. LDLR is increased and delocalized in the hippocampus of PSAPP mice compared to NTG controls.
(A) Representative images at 5× magnification of immunohistochemistry staining of the CA3 region of the hippocampus and an enlarged view of a representative hippocampal cell surrounding the neuronal layer of a PSAPP and NTG mouse. Mice were 10-month old PSAPP and NTG. LDLR signal is in red and cell nuclei are in blue. Arrowhead in PSAPP hippocampal neuron indicates the concentration LDLR-positive signal. (B) Quantification of LDLR-positive signal normalized by the DAPI signal in hippocampus of PSAPP and NTG mice. Experiments were done in triplicate using brain sections of 8 mice for each condition.
Figure 8
Figure 8. γ-tubulin signal is more widely distributed in H4-APP cells compared to H4 controls.
(A) Immunohistochemistry imaging at 400× magnification of LDLR and γ-tubulin in H4 and H4-APP cells. Red, green, and blue signals correspond to LDLR, γ-tubulin, and cell nuclei, respectively. Arrowheads indicate three examples of H4-APP cells containing greater area of γ-tubulin signal distribution. (B) Larger image of a selected cell from the same slide. Merged images in A and B show the location of LDLR in relation to γ-tubulin and the nucleus. (C) Percentage of diffuse γ-tubulin signal in H4 compared to H4-APP cells. Quantification is described in further detail in Figure S2.
Figure 9
Figure 9. α-tubulin is less widely distributed in H4-APP cells compared to H4 controls.
(A) Immunohistochemistry imaging at 400× magnification of LDLR and α-tubulin in H4 and H4-APP cells. Red, green, and blue signals correspond to LDLR, α-tubulin, and cell nuclei, respectively. Arrowheads indicate three examples of H4-APP cells containing less diffuse α-tubulin. (B) Larger images of selected cells from panel A. Merged images in A and B show the location of LDLR in relation to α-tubulin and the nucleus. (C) Percentage of diffuse α-tubulin signal in H4 compared to H4-APP cells. Quantification is described in further detail in Figure S2.
Figure 10
Figure 10. Proposed mechanism by which APP/Aβ overexpression diminishes LDLR trafficking by disrupting microtubule formation.
Overexpression of APP/Aβ causes microtubule destabilization by altering the centrosome, and consequently, polymerized microtubules. As a result, LDLR trafficking from the TGN to the plasma membrane is impaired. Therefore, LDLR accumulates in the TGN. The implications are that the cell may be unable to import cholesterol effectively, which causes transcriptional activation of the LDLR gene.

Similar articles

Cited by

References

    1. Glenner GG, Wong CW. Alzheimer's disease: initial report of the purification and characterization of a novel cerebrovascular amyloid protein. Biochem Biophys Res Commun. 1984;120:885–890. - PubMed
    1. Strittmatter WJ, Saunders AM, Schmechel D, Pericak-Vance M, Enghild J, et al. Apolipoprotein E: high-avidity binding to beta-amyloid and increased frequency of type 4 allele in late-onset familial Alzheimer disease. Proc Natl Acad Sci U S A. 1993;90:1977–1981. - PMC - PubMed
    1. Potter H, Wefes IM, Nilsson LN. The inflammation-induced pathological chaperones ACT and apo-E are necessary catalysts of Alzheimer amyloid formation. Neurobiol Aging. 2001;22:923–930. - PubMed
    1. Mahley RW, Weisgraber KH, Huang Y. Apolipoprotein E4: a causative factor and therapeutic target in neuropathology, including Alzheimer's disease. Proc Natl Acad Sci U S A. 2006;103:5644–5651. - PMC - PubMed
    1. Saunders AM, Strittmatter WJ, Schmechel D, George-Hyslop PH, Pericak-Vance MA, et al. Association of apolipoprotein E allele epsilon 4 with late-onset familial and sporadic Alzheimer's disease. Neurology. 1993;43:1467–1472. - PubMed

Publication types