. 2012 Mar;11(1):121-31.
doi: 10.1007/s12311-009-0151-3.

Calcium influx measured at single presynaptic boutons of cerebellar granule cell ascending axons and parallel fibers

Affiliations

Calcium influx measured at single presynaptic boutons of cerebellar granule cell ascending axons and parallel fibers

Wei Zhang et al. Cerebellum. 2012 Mar.

Abstract

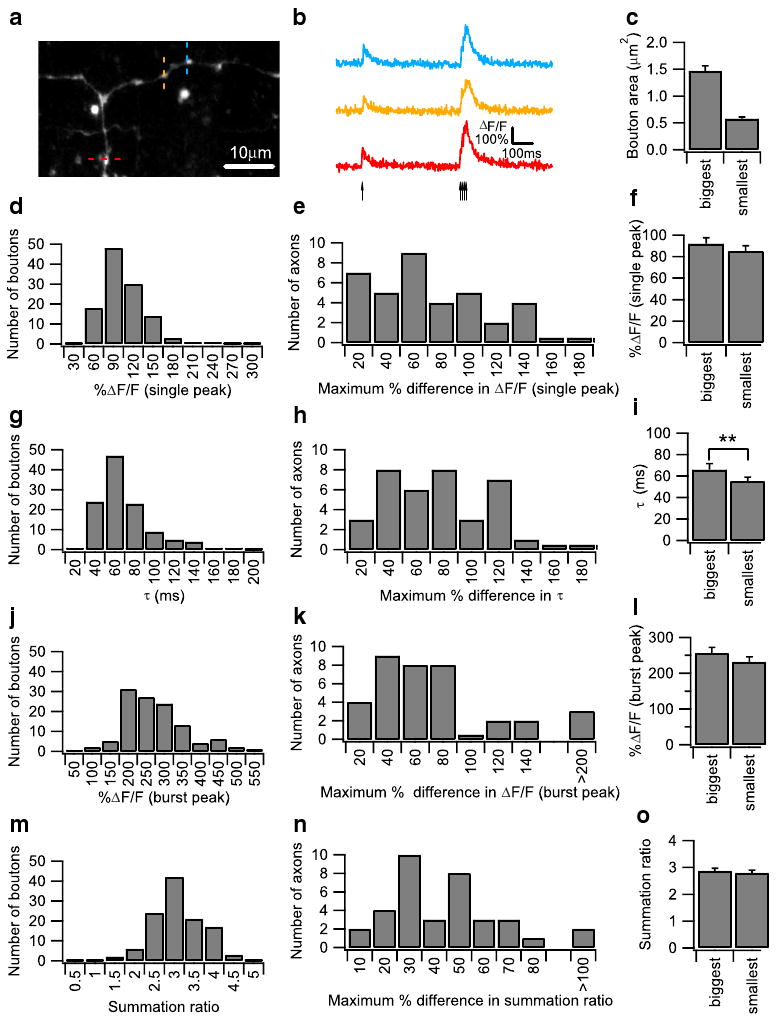
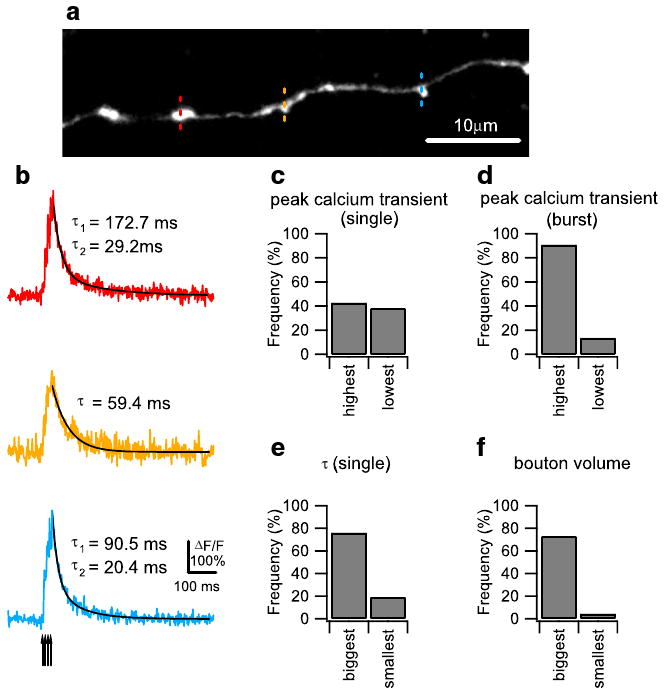
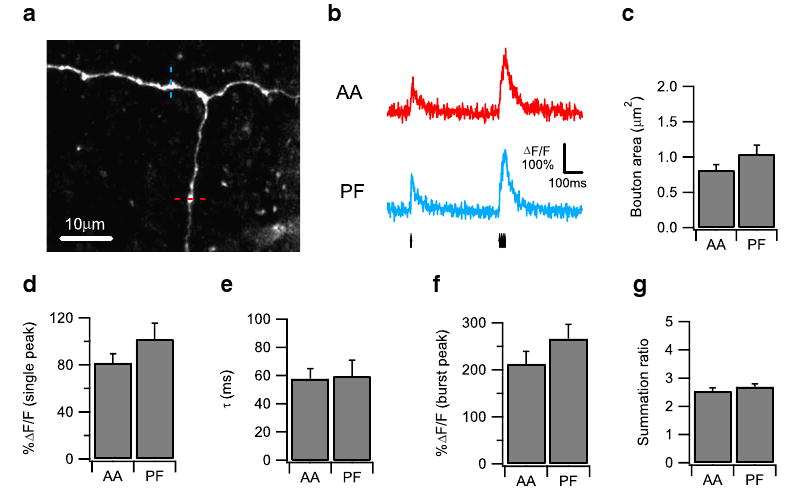
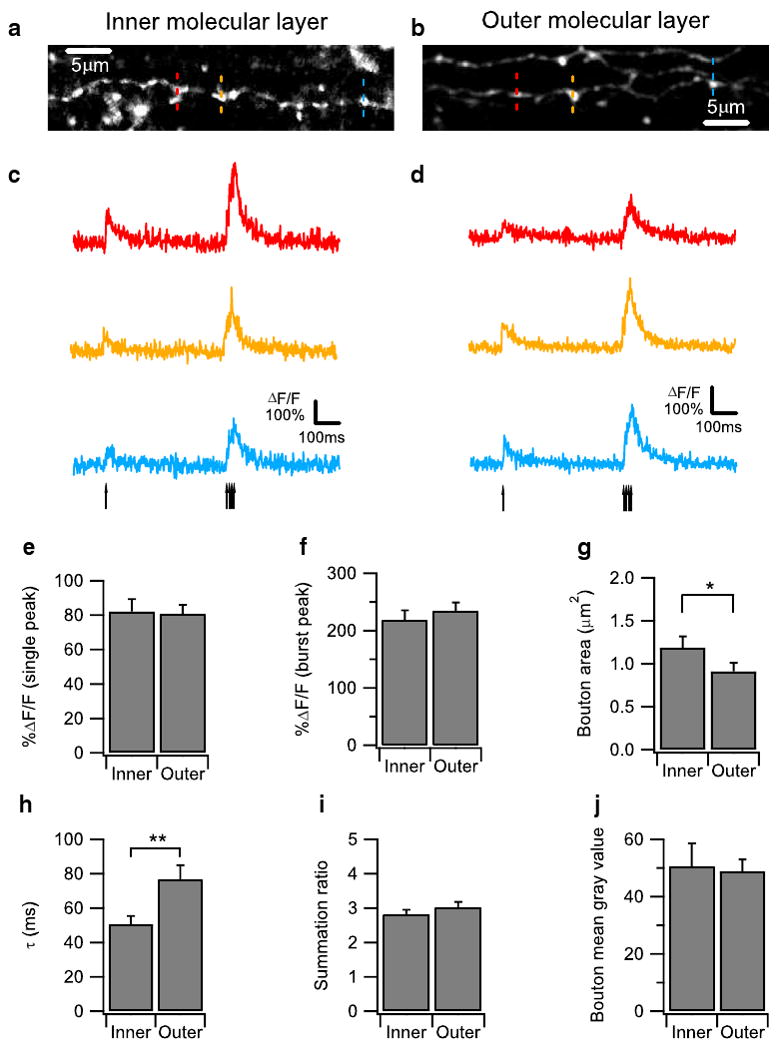
Action potential-evoked calcium influx into presynaptic boutons is a key determinant of synaptic strength and function. Here, we have examined the calcium dynamics at individual presynaptic boutons of the cerebellar granule cells in the molecular layer of cerebellar slices and investigated whether different subpopulations of granule cell boutons exhibit different calcium dynamics. We found that a population of boutons with low basal calcium clearance rates may activate a second clearance mechanism and exhibit biphasic calcium decay on high calcium influx induced by bursts of action potentials. We also found that boutons on ascending axons and parallel fibers show similar calcium influx amplitudes and calcium clearance rates in response to action potentials. Lastly, we found that parallel fiber boutons located in the inner molecular layer have a higher calcium clearance rate than boutons located in the outer molecular layer. These results suggest that cerebellar granule cell boutons should not be regarded as a homogeneous population, but rather that different subpopulations of boutons may exhibit different properties. The heterogeneity of presynaptic boutons may allow different learned behaviors to be encoded in the same circuit without mutual interference and may be a general mechanism for increasing the computational capacity of the brain.


Figures

Fig. 1
Fig. 1
Heterogeneity of action potential (AP)-evoked Ca2+ transients in granule cell axonal boutons. a A Z-projection confocal stack image showing a dye-loaded parallel fiber (PF). Individual boutons appear as bead-like varicosities along axons. Ca2+ imaging was performed sequentially on three individual boutons located on the ascending axon or the PF as indicated by the red, yellow, and blue dotted lines. This confocal stack image was projected by summing pixel intensities. b Representative AP-evoked Ca2+ transients measured from three neighboring boutons on the same PF shown in (a) were plotted as ΔF/F over time. Ca2+ transients were evoked by a protocol consisting of a single AP followed 500 ms later by a burst of four pulses at 100 Hz. The arrows indicate the onset of the individual AP. The averaged traces from ten trials are shown. c Bar graph showing average bouton areas of the biggest and smallest boutons on a single PF axon, measured from 34 axons. Bouton areas were determined from the Z-projection of confocal images of the dye-filled bouton obtained after calcium imaging. Histograms of the single AP-evoked Ca2+ peak amplitude (d) and decay time constant (g), as well as the burst AP-evoked peak amplitude (j) and summation ratio (m) from 115 granule cell boutons, are presented. The summation ratio was calculated as the peak Ca2+ transient evoked by the burst AP divided by the peak Ca2+ transient evoked by the single AP. Histograms of the maximum percentage difference in single AP-evoked Ca2+ response amplitude (e) and decay time constant (h), as well as the burst AP-evoked Ca2+ response amplitude (k) and summation ratio (n) from three boutons measured on the same axon from 36 axons, are presented. Comparison of various parameters between the biggest and smallest boutons on the same axon. Axons were only included if the biggest bouton was at least 60% larger in volume compared with the smallest bouton, and 34 axons were compared in total. Bar graphs showing the single AP-evoked Ca2+ response amplitude (f) and decay time constant (i), as well as the burst AP-evoked Ca2+ response amplitude (l) and summation ratio (o), are shown. Error bars indicate the SEM in this and all subsequent figures
Fig. 2
Fig. 2
Double- and single-exponential decay time course of action potential (AP)-evoked Ca2+ transients in granule cell axonal boutons. a A Z-projection confocal stack image showing a representative dye-loaded parallel fiber (PF). Ca2+ imaging was performed sequentially on three individual boutons indicated by the red, yellow, and blue dotted lines. The confocal stack image was projected by summing pixel intensities. b Burst (four pulses at 100 Hz) AP-evoked Ca2+ transients measured sequentially from three neighboring boutons on the same PF shown in (a). The average traces from five trials are shown. Ca2+ responses were well fit by single-exponential decay curve (yellow) or double-exponential curves (red and blue), shown as superimposed black lines. The arrow indicates the onset of the individual AP during the burst stimulation. Comparison of the frequency of occurrence of double-exponential decay mode of calcium clearance in different groups of granule cell boutons. To divide boutons into two groups based on their single AP-evoked Ca2+ response amplitude and decay time constant and burst AP-evoked Ca2+ response amplitude, we included axons only if the difference between the largest and smallest response was at least 10% of the smallest response. To divide boutons based on volume, we only included axons where the biggest bouton was at least 60% larger in volume compared with the smallest bouton. Bar graphs showing the percentage frequency of boutons exhibiting double-exponential decay time course in groups of boutons divided by single AP-evoked Ca2+ response amplitude (c; 21 axons), burst AP-evoked Ca2+ response amplitude (d; 22 axons), single AP-evoked Ca2+ response decay time constant (e; 21 axons), and bouton volume (f; 22 axons) are presented
Fig. 3
Fig. 3
Boutons on the ascending axon (AA) and the parallel fiber (PF) show similar properties in action potential (AP)-evoked Ca2+ response. a A Z-projection confocal stack image showing a representative dye-loaded granule cell axon with PF bifurcated from AA. AP-evoked Ca2+ responses were measured sequentially at the individual boutons on the AA (indicated by red dotted line) and PF (indicated by blue dotted line). b Representative AP-evoked Ca2+ transients measured from an AA bouton (red) and a PF bouton (blue) on the same granule cell axon shown in (a) plotted as ΔF/F over time. Ca2+ transients were evoked by a protocol consisting of a single AP followed 500 ms later by a burst of four pulses at 100 Hz. The arrows indicate the onset of the individual AP. The averaged traces from ten trials are shown. Bar graphs comparing the bouton area (c), the single AP-evoked Ca2+ response amplitude (d), the single AP-evoked Ca2+ response decay time constant (e), the burst AP-evoked Ca2+ response amplitude (f), and the Ca2+ response summation ratio (g) between an AA bouton and a PF bouton on the same axon are shown, measured from 16 pairs of boutons on ten axons
Fig. 4
Fig. 4
Parallel fiber (PF) boutons located in the outer molecular layer show slower action potential (AP)-evoked Ca2+ response decay kinetics than those in inner molecular layer. a, b Z-projection confocal stack images showing a dye-loaded PF located in inner molecular layer (a) and outer molecular layer (b), respectively. Ca2+ imaging was performed sequentially on three individual boutons located on the PFs as indicated by the red, yellow, and blue dotted lines. This confocal stack image was projected by summing pixel intensities. c, d Representative AP-evoked Ca2+ transients measured from three neighboring boutons on the same PFs in the inner molecular layer (a) and outer molecular layer (b) were plotted as ΔF/F over time. Ca2+ transients were evoked by a protocol consisting of a single AP followed 500 ms later by a burst of four APs at 100 Hz The arrows indicate the onset of the individual AP. The averaged traces from ten trials are shown. Bar graphs comparing (e), (f), (h), and (i) are bar graphs showing the single AP-evoked Ca2+ response amplitude (e), the burst AP-evoked Ca2+ response amplitude (f), single AP-evoked Ca2+ response decay time constant (h), and the Ca2+ response summation ratio (i) between PF boutons located in the inner and the outer molecular layers are shown. PF boutons located in outer molecular layer show a larger single AP-evoked Ca2+ response decay time constant than those in inner molecular layer (h), indicating slower decay kinetics. g Bar graph comparing the bouton areas of PF boutons located in the inner and outer molecular layers. j Bar graph showing the bouton's mean gray value comparing the PF boutons located in the inner molecular layer and the outer molecular layer. 21 boutons from seven PFs were quantified for each group

Similar articles

Cited by

References

    1. Napper RM, Harvey RJ. Number of parallel fiber synapses on an individual Purkinje cell in the cerebellum of the rat. J Comp Neurol. 1988;274(2):168–177. - PubMed
    1. Palay SL, Chan-Palay V. Cerebellar cortex: cytology and organization. Springer-Verlag, Berlin; 1974.
    1. Braitenberg V, Atwood RP. Morphological observations on the cerebellar cortex. J Comp Neurol. 1958;109(1):1–33. - PubMed
    1. Eccles JC, Ito M, Szentagothai J. The cerebellum as a neuronal machine. Springer; Berlin: 1967.
    1. Eccles JC, Llinas R, Sasaki K. Parallel fibre stimulation and the responses induced thereby in the Purkinje cells of the cerebellum. Exp Brain Res. 1966;1(1):17–39. - PubMed

Publication types

MeSH terms

LinkOut - more resources