

Effects of membrane depolarization and changes in extracellular [K(+)] on the Ca (2+) transients of fast skeletal muscle fibers. Implications for muscle fatigue
- PMID: 20049631
- PMCID: PMC2908756
- DOI: 10.1007/s10974-009-9195-8
Effects of membrane depolarization and changes in extracellular [K(+)] on the Ca (2+) transients of fast skeletal muscle fibers. Implications for muscle fatigue
Abstract
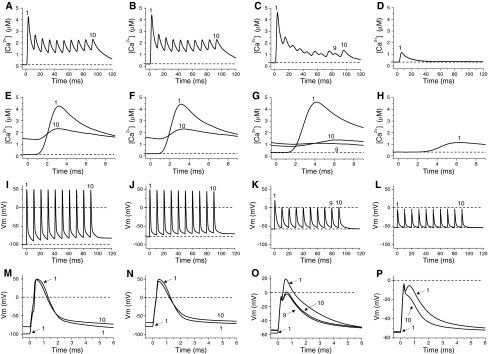
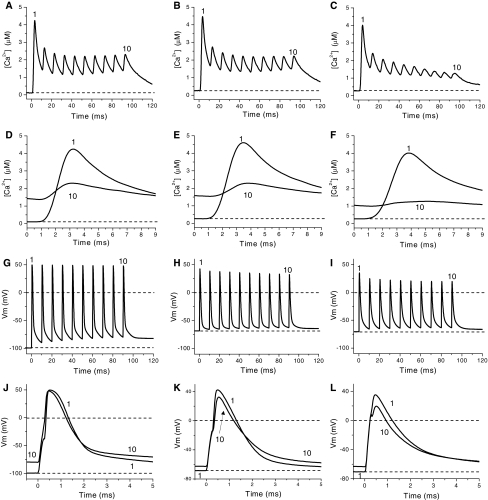
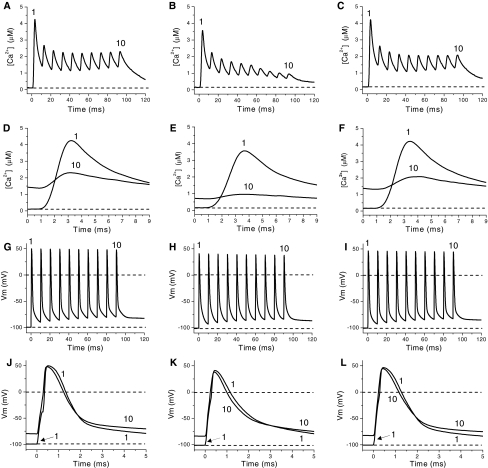
Repetitive activation of skeletal muscle fibers leads to a reduced transmembrane K(+) gradient. The resulting membrane depolarization has been proposed to play a major role in the onset of muscle fatigue. Nevertheless, raising the extracellular K(+) K(+)(O) concentration ([K(+)](O)) to 10 mM potentiates twitch force of rested amphibian and mammalian fibers. We used a double Vaseline gap method to simultaneously record action potentials (AP) and Ca(2+) transients from rested frog fibers activated by single and tetanic stimulation (10 pulses, 100 Hz) at various [K(+)](O) and membrane potentials. Depolarization resulting from current injection or raised [K(+](O) produced an increase in the resting [Ca(2+)]. Ca(2+) transients elicited by single stimulation were potentiated by depolarization from -80 to -60 mV but markedly depressed by further depolarization. Potentiation was inversely correlated with a reduction in the amplitude, overshoot and duration of APs. Similar effects were found for the Ca(2+) transients elicited by the first pulse of 100 Hz trains. Depression or block of Ca(2+) transient in response to the 2nd to 10th pulses of 100 Hz trains was observed at smaller depolarizations as compared to that seen when using single stimulation. Changes in Ca(2+) transients along the trains were associated with impaired or abortive APs. Raising [K(+)](O) to 10 mM potentiated Ca(2+) transients elicited by single and tetanic stimulation, while raising [K(+)](O) to 15 mM markedly depressed both responses. The effects of 10 mM K(+)(O) on Ca(2+) transients, but not those of 15 mM K(+)(O), could be fully reversed by hyperpolarization. The results suggests that the force potentiating effects of 10 mM K(+)(O) might be mediated by depolarization dependent changes in resting [Ca(2+)] and Ca(2+) release, and that additional mechanisms might be involved in the effects of 15 mM K(+)(O) on force generation.
Figures


Similar articles
-
Extracellular Ca2+-induced force restoration in K+-depressed skeletal muscle of the mouse involves an elevation of [K+]i: implications for fatigue.J Appl Physiol (1985). 2015 Mar 15;118(6):662-74. doi: 10.1152/japplphysiol.00705.2013. Epub 2015 Jan 8. J Appl Physiol (1985). 2015. PMID: 25571990 Free PMC article.
-
The peak force-resting membrane potential relationships of mouse fast- and slow-twitch muscle.Am J Physiol Cell Physiol. 2022 Jun 1;322(6):C1151-C1165. doi: 10.1152/ajpcell.00401.2021. Epub 2022 Apr 6. Am J Physiol Cell Physiol. 2022. PMID: 35385328
-
Moderately elevated extracellular [K+] potentiates submaximal force and power in skeletal muscle via increased [Ca2+]i during contractions.Am J Physiol Cell Physiol. 2019 Nov 1;317(5):C900-C909. doi: 10.1152/ajpcell.00104.2019. Epub 2019 Aug 14. Am J Physiol Cell Physiol. 2019. PMID: 31411922
-
Potassium-transporting proteins in skeletal muscle: cellular location and fibre-type differences.Acta Physiol (Oxf). 2010 Feb;198(2):105-23. doi: 10.1111/j.1748-1716.2009.02043.x. Epub 2009 Sep 21. Acta Physiol (Oxf). 2010. PMID: 19769637 Review.
-
A study of the mechanisms of excitation-contraction coupling in frog skeletal muscle based on measurements of [Ca2+] transients inside the sarcoplasmic reticulum.J Muscle Res Cell Motil. 2018 Apr;39(1-2):41-60. doi: 10.1007/s10974-018-9497-9. Epub 2018 Aug 24. J Muscle Res Cell Motil. 2018. PMID: 30143958 Review.
Cited by
-
A computational model of torque generation: neural, contractile, metabolic and musculoskeletal components.PLoS One. 2013;8(2):e56013. doi: 10.1371/journal.pone.0056013. Epub 2013 Feb 6. PLoS One. 2013. PMID: 23405245 Free PMC article.
-
Beyond Nernst: the effects of extracellular potassium on post-tetanic twitch potentiation in skeletal muscle.Pflugers Arch. 2022 Jun;474(6):573-574. doi: 10.1007/s00424-022-02704-9. Epub 2022 May 9. Pflugers Arch. 2022. PMID: 35527323 No abstract available.
-
Regulation of muscle potassium: exercise performance, fatigue and health implications.Eur J Appl Physiol. 2021 Mar;121(3):721-748. doi: 10.1007/s00421-020-04546-8. Epub 2021 Jan 4. Eur J Appl Physiol. 2021. PMID: 33392745 Review.
-
Prevalence and associated factors of postoperative suxamethonium-induced myalgia in surgical patients at Debre Tabor Comprehensive Specialized Hospital Ethiopia: a cross-sectional study.Sci Rep. 2024 Jul 17;14(1):16552. doi: 10.1038/s41598-024-65779-7. Sci Rep. 2024. PMID: 39019942 Free PMC article.
-
Longitudinal and transversal propagation of excitation along the tubular system of rat fast-twitch muscle fibres studied by high speed confocal microscopy.J Physiol. 2012 Feb 1;590(3):475-92. doi: 10.1113/jphysiol.2011.221796. Epub 2011 Dec 12. J Physiol. 2012. PMID: 22155929 Free PMC article.
References
-
- Balog EM, Fitts RH. Effects of fatiguing stimulation on intracellular Na+ and K+ in frog skeletal muscle. J Appl Physiol. 1996;81(2):679–685. - PubMed
-
- Balog EM, Thompson LV, et al. Role of sarcolemma action potentials and excitability in muscle fatigue. J Appl Physiol. 1994;76(5):2157–2162. - PubMed
Publication types
MeSH terms
Substances
LinkOut - more resources
Full Text Sources
Medical
Miscellaneous
