

Modulation of mitochondrial protein phosphorylation by soluble adenylyl cyclase ameliorates cytochrome oxidase defects
- PMID: 20049744
- PMCID: PMC2814779
- DOI: 10.1002/emmm.200900046
Modulation of mitochondrial protein phosphorylation by soluble adenylyl cyclase ameliorates cytochrome oxidase defects
Abstract
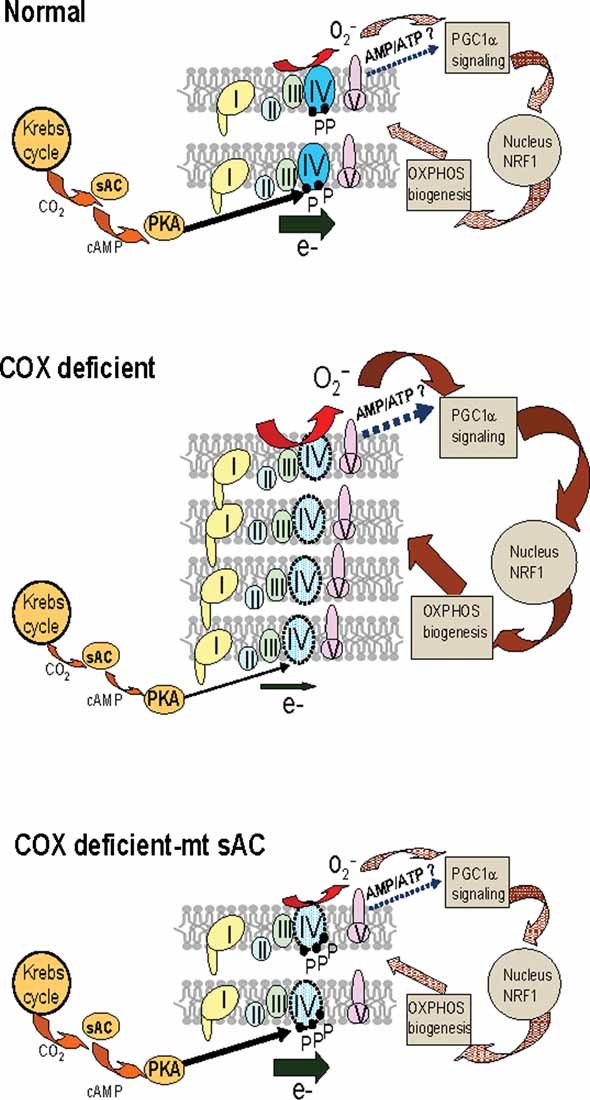
Phosphorylation of respiratory chain components has emerged as a mode of regulation of mitochondrial energy metabolism, but its mechanisms are still largely unexplored. A recently discovered intramitochondrial signalling pathway links CO(2) generated by the Krebs cycle with the respiratory chain, through the action of a mitochondrial soluble adenylyl cyclase (mt-sAC). Cytochrome oxidase (COX), whose deficiency causes a number of fatal metabolic disorders, is a key mitochondrial enzyme activated by mt-sAC. We have now discovered that the mt-sAC pathway modulates mitochondrial biogenesis in a reactive oxygen species dependent manner, in cultured cells and in animals with COX deficiency. We show that upregulation of mt-sAC normalizes reactive oxygen species production and mitochondrial biogenesis, thereby restoring mitochondrial function. This is the first example of manipulation of a mitochondrial signalling pathway to achieve a direct positive modulation of COX, with clear implications for the development of novel approaches to treat mitochondrial diseases.
Figures
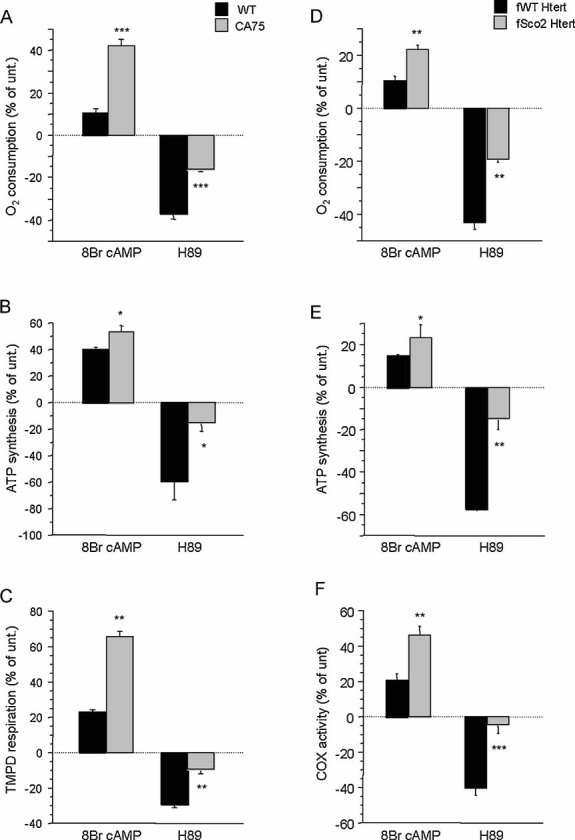
Mitochondrial respiration in intact cells (WT unt., n = 22; WT 8Br-cAMP, n = 9; WT H89, n = 9; CA75 unt., n = 9; CA75 8Br-cAMP, n = 5; CA75 H89, n = 5).
ATP synthesis driven by pyruvate plus malate (n = 3 for all samples).
TMPD/ascorbate driven respiration (n = 7 for all unt. samples, and n = 3 for all treated samples). OXPHOS function was also assessed in human WT and Sco2 mutant fibroblasts by:
Intact cell respiration (n = 7),
ATP synthesis (n = 6) and
COX enzymatic activity (n = 6). For each cell line, changes induced by the treatments are indicated as a percentage of untreated controls (unt.). *, p < 0.01; **, p < 0.001; ***, p < 0.0001.
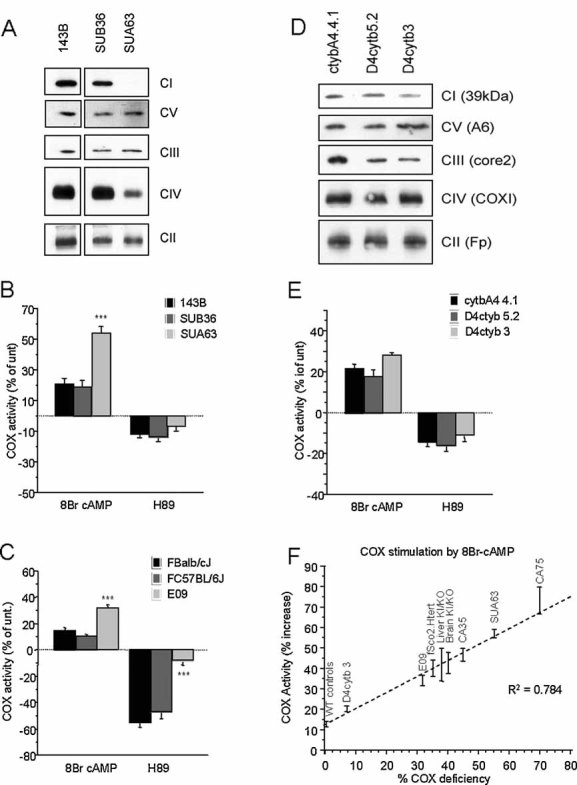
BNGE Western blot of respiratory chain complexes in homoplasmic MELAS cybrids SUA63 and isogenic WT control cybrids SUB36.
8Br-cAMP and H89 modulation of COX activity in MELAS cybrids and controls (n = 7).
8Br-cAMP and H89 modulation of COX activity in mouse homoplasmic COXI mutant fibroblasts (E09) and WT controls (n = 4).
BNGE Western blot of respiratory chain complexes in heteroplasmic Cyt b mutant cybrids (D4cytb 5.2 and D4cytb 3) and isogenic WT control cybrids.
8Br-cAMP and H89 modulation of COX activity in heteroplasmic Cyt b mutant cybrids and WT controls (n = 8). Values in (B), (C) and (E) are shown as percentage of untreated controls for each cell line. *, p < 0.01; **, p < 0.001; ***, p < 0.0001.
Correlation plot between the percentage of residual COX activity and the percentage of COX stimulation upon 8Br-cAMP treatment, in the indicated COX deficient models. The percentages of COX stimulation by 8Br-cAMP is relative to untreated and is shown as the average ± SD of n = 5 determinations for each indicated COX deficient group. WT controls are averages (± SD) of non-COX deficient cells (143B, fWT Htert, SUB36, FBalb/cJ, FC57BL/6J, cytbA4 4.1, D4cytb 5.2) and tissues (brain WT and liver WT).
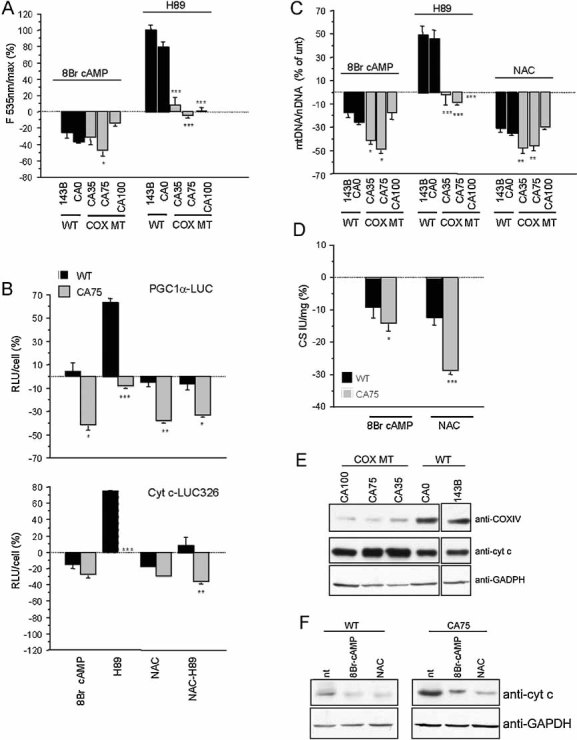
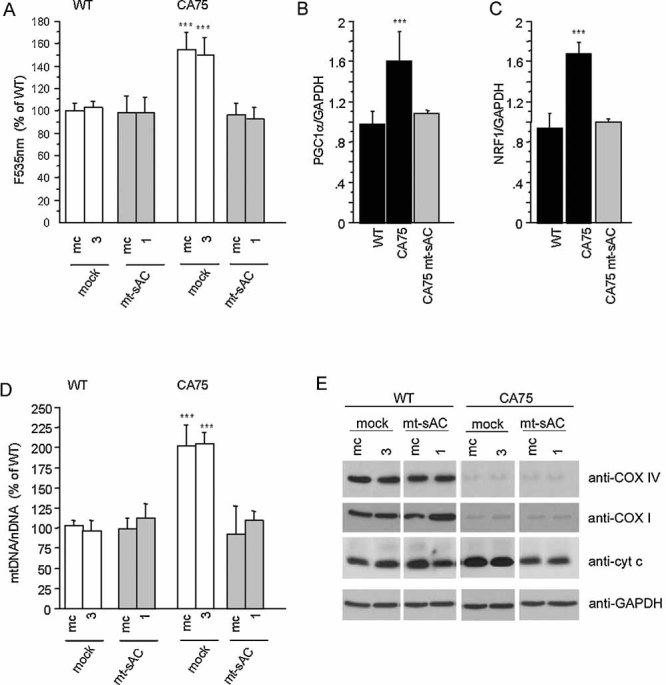
WT and COXI mutant cybrids were incubated for 2 h in the presence of 8Br-cAMP or H89 and ROS production was measured by DCFDA fluorescence. Changes in fluorescence induced by the treatments are indicated as a percentage of untreated controls (unt.) (n = 9).
LUC activity in PGC1α–LUC (upper panel) or Cyt c–LUC 326 (lower panel) transfected WT and CA75 cells, after 48 h treatment with 8Br-cAMP, H89, NAC or H89 plus NAC. Luminescence was normalized by the number of cells (RLU/cell ratio). Values are shown as a percentage of untreated controls for each cell line and represent the mean of three independent transfections, each measured in triplicates.
MtDNA content after 48 h treatment with 8Br-cAMP, H89 or NAC (n = 7).
Citrate synthase (CS) enzymatic activity after 48 h treatment with 8Br-cAMP or NAC (n = 6). In (C) and (D), values are shown as a percentage of untreated controls for each cell line. *, p < 0.01; **, p < 0.001; ***, p < 0.0001.
Western blot for COXIV and Cyt c in COXI mutant cybrids and WT controls ran under the same conditions. Reprobing the blots with GAPDH confirms that same amount of proteins was loaded for all cell lines.
Western blot for Cyt c in CA75 cybrids and WT controls after 48 h treatment with 8Br-cAMP and NAC. Panels (E) and (F) show representative Western blots from three independent experiments.

Scheme of the sAC and the mitochondrially targeted sAC (mt-sAC) genetic constructs. P1 is the mitochondrial targeting peptide of the human P1 isoform of ATPase subunit c. Four amino acid of the mature subunit c (sub c) are included in the construct. The rat sAC gene is cloned downstream of the targeting peptide and contains an HA epitope tag.
COS-1 cells expressing the empty vector (mock), sAC or mt-sAC were stained with Mitotracker (in red) and immuno-stained for HA (in green). In the merged images, colocalization of sAC and mitochondria is indicated by the overlap of the fluorescence (i.e. in yellow).
sAC and mt-sAC distribution in subcellular fractions of transfected COS-1 cells. Total cell homogenate (T), mitochondrial fraction (M), cytosolic fraction (C). β-Actin and Tim23 are markers of cytosolic and mitochondrial proteins, respectively.
cAMP levels in sAC and mt-sAC expressing cells measured in total cell homogenates (T) and in the mitochondria containing pellets (P), which result from plasma membrane permeabilization followed by centrifugation. ***, p < 0.0001.
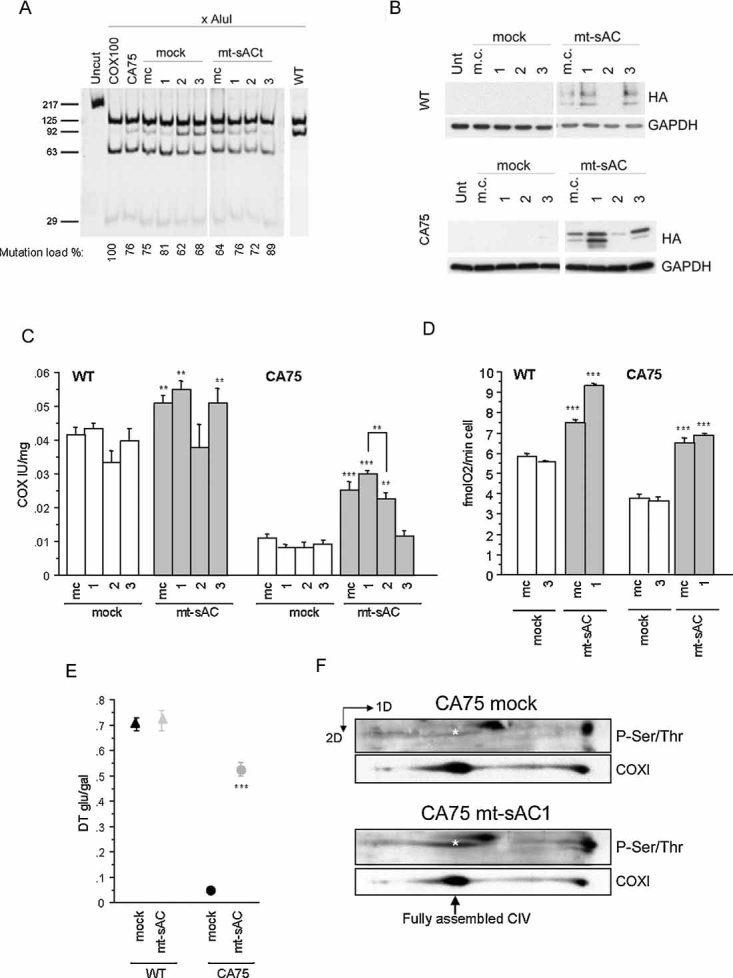
COXI mutation load measured by last hot cycle PCR followed by AluI digestion in mass culture (m.c.) and individual clones of CA75 stably expressing mt-sAC. The level of heteroplasmy indicated as a percentage of mutant mtDNA is indicated below each lane, and represents the mean value of two independent determinations. WT lane originates from a different gel run in parallel with the CA75 samples.
mt-sAC expression in total cell homogenates of WT and CA75 m.c. and clones ran under the same conditions determined by immunoblot with HA antibody. Reprobing the blots with GAPDH confirms that same amount of proteins was loaded for all cell lines.
COX enzymatic activity in cell lysates of WT (on the left) or CA75 (on the right) expressing mt-sAC (n = 6).
Intact cell respiration in WT (on the left) or CA75 (on the right) cells expressing mt-sAC (n = 6).
The ratio of the doubling time in glucose medium and in galactose medium (DT glu/gal) in WT or CA75 cells expressing mt-sAC (n = 4). In panels, C–E, *, p < 0.01; **, p < 0.001; ***, p < 0.0001.
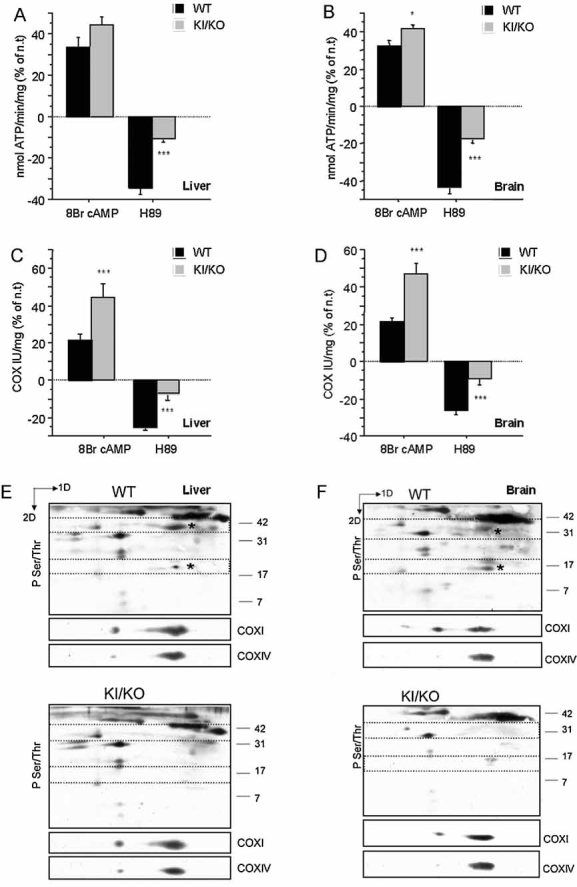
2D-BNGE of isolated mitochondria from mt-sAC expressing or mock transfected CA75 cells followed by successive immunodetection for phosphorylated proteins and COXI. The position of the fully assembled, monomeric, COX (CIV) is indicated by the arrow. The asterisk indicates the phosphorylated COXI, which is significantly lower in mock transfected than in mt-sAC expressing cells. The blots shown are representative of two independent experiments.
Comment in
-
Making the most of what you've got: optimizing residual OXPHOS function in mitochondrial diseases.EMBO Mol Med. 2009 Nov;1(8-9):357-9. doi: 10.1002/emmm.200900049. EMBO Mol Med. 2009. PMID: 20049740 Free PMC article.
References
-
- Acin-Perez R, Bayona-Bafaluy MP, Bueno M, Machicado C, Fernandez-Silva P, Perez-Martos A, Montoya J, Lopez-Perez MJ, Sancho J, Enriquez JA. An intragenic suppressor in the cytochrome c oxidase I gene of mouse mitochondrial DNA. Hum Mol Genet. 2003;12:329–339. - PubMed
-
- Bender E, Kadenbach B. The allosteric ATP-inhibition of cytochrome c oxidase activity is reversibly switched on by cAMP-dependent phosphorylation. FEBS Lett. 2000;466:130–134. - PubMed
-
- Birch-Machin MA, Turnbull DM. Assaying mitochondrial respiratory complex activity in mitochondria isolated from human cells and tissues. Methods Cell Biol. 2001;65:97–117. - PubMed
Publication types
MeSH terms
Substances
Grants and funding
LinkOut - more resources
Full Text Sources
Other Literature Sources
