

Falling into the coverage gap: Part D drug costs and adherence for Medicare Advantage prescription drug plan beneficiaries with diabetes
- PMID: 20050931
- PMCID: PMC2838150
- DOI: 10.1111/j.1475-6773.2009.01071.x
Falling into the coverage gap: Part D drug costs and adherence for Medicare Advantage prescription drug plan beneficiaries with diabetes
Abstract
Objective: To compare drug costs and adherence among Medicare beneficiaries with the standard Part D coverage gap versus supplemental gap coverage in 2006.
Data sources: Pharmacy data from Medicare Advantage Prescription Drug (MAPD) plans.
Study design: Parallel analyses comparing beneficiaries aged 65+ with diabetes in an integrated MAPD with a gap versus no gap (n=28,780); and in a network-model MAPD with a gap versus generic-only coverage during the gap (n=14,984).
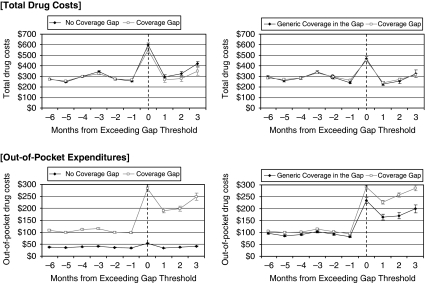
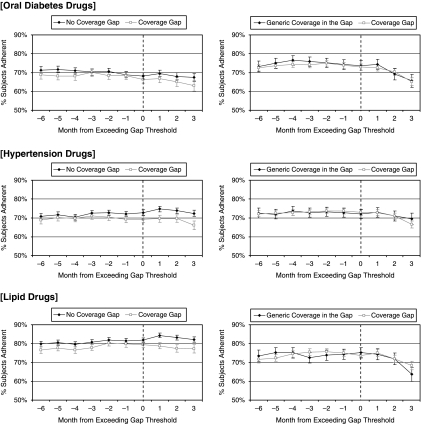
Principal findings: Drug spending was 3 percent (95 percent confidence interval [CI]: 1-4 percent) and 4 percent (CI: 1-6 percent) lower among beneficiaries with a gap versus full or generic-only gap coverage, respectively. Out-of-pocket expenditures were 189 percent higher (CI: 185-193 percent) and adherence to three chronic drug classes was lower among those with a gap versus no gap (e.g., odds ratio=0.83, CI: 0.79-0.88, for oral diabetes drugs). Annual out-of-pocket spending was 14 percent higher (CI: 10-17 percent) for beneficiaries with a gap versus generic-only gap coverage, but levels of adherence were similar.
Conclusions: Among Medicare beneficiaries with diabetes, having the Part D coverage gap resulted in lower total drug costs, but higher out-of-pocket spending and worse adherence compared with having no gap. Having generic-only coverage during the gap appeared to confer limited benefits compared with having no gap coverage.
Figures
Similar articles
-
Patterns of prescription drug expenditures and medication adherence among medicare part D beneficiaries with and without the low-income supplement.BMC Health Serv Res. 2014 Dec 20;14:665. doi: 10.1186/s12913-014-0665-3. BMC Health Serv Res. 2014. PMID: 25526892 Free PMC article.
-
Effects of Medicare Part D coverage gap on medication adherence.Am J Manag Care. 2013 Jun 1;19(6):e214-24. Am J Manag Care. 2013. PMID: 23844750 Free PMC article.
-
Adherence and persistence to prescribed medication therapy among Medicare part D beneficiaries on dialysis: comparisons of benefit type and benefit phase.J Manag Care Spec Pharm. 2014 Aug;20(8):862-76. doi: 10.18553/jmcp.2014.20.8.862. J Manag Care Spec Pharm. 2014. PMID: 25062080 Free PMC article.
-
Medicare part D: ongoing challenges for doctors and patients.Annu Rev Med. 2010;61:469-76. doi: 10.1146/annurev.med.080608.091704. Annu Rev Med. 2010. PMID: 20059349 Review.
-
Impact of U.S. federal and state generic drug policies on drug use, spending, and patient outcomes: A systematic review.Res Social Adm Pharm. 2020 Jun;16(6):736-745. doi: 10.1016/j.sapharm.2019.08.031. Epub 2019 Aug 17. Res Social Adm Pharm. 2020. PMID: 31445986
Cited by
-
The Affordable Care Act and Diabetes Diagnosis and Care: Exploring the Potential Impacts.Curr Diab Rep. 2016 Apr;16(4):27. doi: 10.1007/s11892-016-0712-z. Curr Diab Rep. 2016. PMID: 26892908 Free PMC article. Review.
-
The introduction of generic aromatase inhibitors and treatment adherence among Medicare D enrollees.J Natl Cancer Inst. 2015 May 12;107(8):djv130. doi: 10.1093/jnci/djv130. Print 2015 Aug. J Natl Cancer Inst. 2015. PMID: 25971298 Free PMC article.
-
The January effect: medication reinitiation among Medicare Part D beneficiaries.Health Econ. 2014 Nov;23(11):1287-300. doi: 10.1002/hec.2981. Epub 2013 Aug 14. Health Econ. 2014. PMID: 23943539 Free PMC article.
-
Cost sharing and decreased branded oral anti-diabetic medication adherence among elderly Part D Medicare beneficiaries.J Gen Intern Med. 2013 Jul;28(7):876-85. doi: 10.1007/s11606-013-2342-3. Epub 2013 Feb 13. J Gen Intern Med. 2013. PMID: 23404199 Free PMC article.
-
Financial hardship from purchasing prescription drugs among older adults in the United States before, during, and after the Medicare Part D "Donut Hole": Findings from 1998, 2001, 2015, and 2021.J Manag Care Spec Pharm. 2022 May;28(5):508-517. doi: 10.18553/jmcp.2022.28.5.508. J Manag Care Spec Pharm. 2022. PMID: 35471065 Free PMC article.
References
-
- Benner JS, Glynn RJ, Mogun H, Neumann PJ, Weinstein MC, Avorn J. Long-Term Persistence in Use of Statin Therapy in Elderly Patients. Journal of the American Medical Association. 2002;288(4):455–61. - PubMed
-
- Buntin MJB, Zaslavsky A. Too Much Ado about Two-Part Models and Transformation: Comparing Methods of Modeling Medicare Expenditures. Journal of Health Economics. 2004;23(3):525–42. - PubMed
-
- Chapman RH, Benner JS, Petrilla AA, Tierce JC, Collins SR, Battleman DS, Schwartz JS. Predictors of Adherence with Antihypertensive and Lipid-Lowering Therapy. Archive of Internal Medicine. 2005;165(10):1147–52. - PubMed
-
- Frank RG, Newhouse JP. 2007. “Mending the Medicare Prescription Drug Benefit: Improving Consumer Choices and Restructuing Purchasing.” The Hamilton Project, The Brookings Institution.
-
- Fung V, Huang J, Brand R, Newhouse JP, Hsu J. Hypertension Treatment in a Medicare Population: Adherence and Systolic Blood Pressure Control. Clinical Therapeutics. 2007;29(5):972–84. - PubMed
Publication types
MeSH terms
Grants and funding
LinkOut - more resources
Full Text Sources
Medical
Miscellaneous
