

Identification of hospital catchment areas using clustering: an example from the NHS
- PMID: 20050933
- PMCID: PMC2838157
- DOI: 10.1111/j.1475-6773.2009.01069.x
Identification of hospital catchment areas using clustering: an example from the NHS
Abstract
Objective: To develop a method of hospital market area identification using multivariate data, and compare it with existing standard methods.
Data sources: Hospital Episode Statistics, a secondary dataset of admissions data from all hospitals in England, between April 2005 and March 2006.
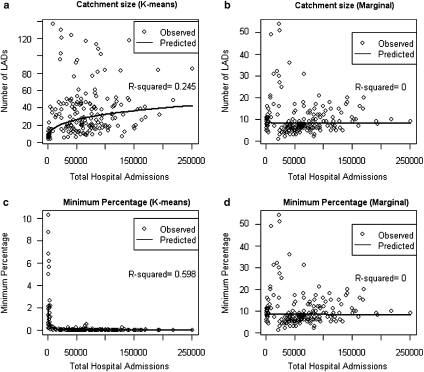
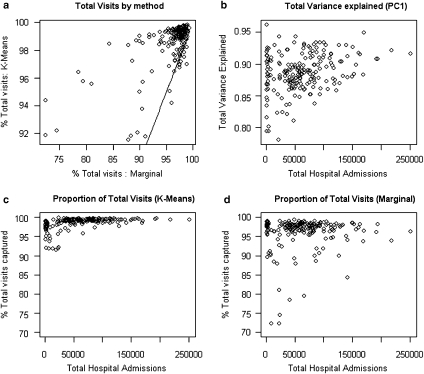
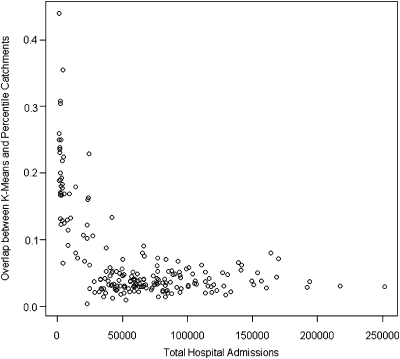
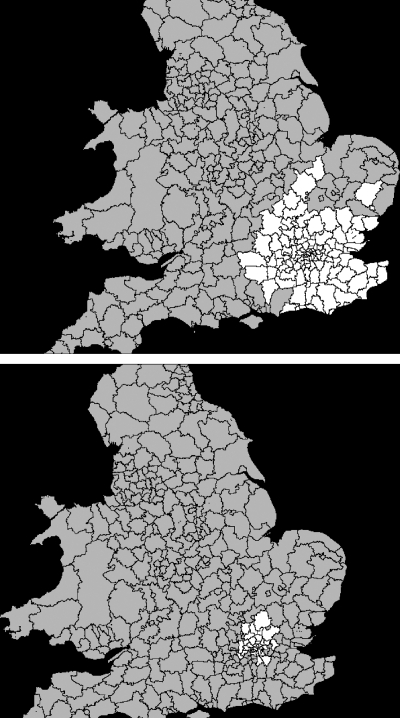
Study design: Seven criteria for catchment area definition were proposed. K-means clustering was used on several variables describing the relationship between hospitals and local authority districts (LADs) to enable the placement of every LAD into or out of the catchment area for every hospital. Principal component analysis confirmed the statistical robustness of the method, and the method was compared against existing methods using the seven criteria.
Principal findings: Existing methods for identifying catchment areas do not capture desirable properties of a hospital market area. Catchment areas identified using K-means clustering are superior to those identified using existing Marginal methods against these criteria and are also statistically robust.
Conclusions: K-means clustering uses multivariate data on the relationship between hospitals and geographical units to define catchment areas that are both statistically robust and more informative than those obtained from existing methods.
Figures
Similar articles
-
A proposed approach in defining population-based rates of major injury from a trauma registry dataset: delineation of hospital catchment areas (I).BMC Health Serv Res. 2008 Apr 10;8:80. doi: 10.1186/1472-6963-8-80. BMC Health Serv Res. 2008. PMID: 18402693 Free PMC article.
-
Modelling catchment areas for secondary care providers: a case study.Health Care Manag Sci. 2011 Sep;14(3):253-61. doi: 10.1007/s10729-011-9154-y. Epub 2011 Apr 1. Health Care Manag Sci. 2011. PMID: 21455707
-
A picture of health: determining the core population served by an urban NHS hospital trust and understanding the key health needs.BMC Public Health. 2022 Jan 12;22(1):75. doi: 10.1186/s12889-021-12373-5. BMC Public Health. 2022. PMID: 35022003 Free PMC article.
-
Quantifying the impact of hospital catchment area definitions on hospital admissions forecasts: COVID-19 in England, September 2020-April 2021.BMC Med. 2024 Apr 17;22(1):163. doi: 10.1186/s12916-024-03369-0. BMC Med. 2024. PMID: 38632561 Free PMC article.
-
Product definition for healthcare contracting: an overview of approaches to measuring hospital output with reference to the UK internal market.J Epidemiol Community Health. 1994 Jun;48(3):224-31. doi: 10.1136/jech.48.3.224. J Epidemiol Community Health. 1994. PMID: 8051519 Free PMC article. Review.
Cited by
-
Use of age-specific hospital catchment populations to investigate geographical variation in inpatient admissions for children and young people in England: retrospective, cross-sectional study.BMJ Open. 2018 Jul 10;8(7):e022339. doi: 10.1136/bmjopen-2018-022339. BMJ Open. 2018. PMID: 29991633 Free PMC article.
-
Determining health-care facility catchment areas in Uganda using data on malaria-related visits.Bull World Health Organ. 2014 Mar 1;92(3):178-86. doi: 10.2471/BLT.13.125260. Epub 2014 Jan 10. Bull World Health Organ. 2014. PMID: 24700977 Free PMC article.
-
Predictive Assessment of Cancer Center Catchment Area from Electronic Health Records.Front Public Health. 2017 Nov 16;5:303. doi: 10.3389/fpubh.2017.00303. eCollection 2017. Front Public Health. 2017. PMID: 29201863 Free PMC article.
-
The use of segmented regression for evaluation of an interrupted time series study involving complex intervention: the CaPSAI project experience.Health Serv Outcomes Res Methodol. 2021;21(2):188-205. doi: 10.1007/s10742-020-00221-9. Epub 2020 Nov 24. Health Serv Outcomes Res Methodol. 2021. PMID: 34720688 Free PMC article.
-
Algorithmic hospital catchment area estimation using label propagation.BMC Health Serv Res. 2022 Jun 27;22(1):828. doi: 10.1186/s12913-022-08127-7. BMC Health Serv Res. 2022. PMID: 35761225 Free PMC article.
References
-
- Adams EK, Wright GE. Hospital Choice of Medicare Beneficiaries in a Rural Market: Why Not the Closest? Journal of Rural Health. 1991;7(1):134–52. - PubMed
-
- Ashton T, Press D. Market Concentration in Secondary Health Services under a Purchaser-Provider Split: The New Zealand Experience. Health Economics. 1997;6:43–56. - PubMed
-
- Basu J. An Analysis of Market Shares of Maryland Hospitals in Their Service Areas. Journal of Health & Social Policy. 1994;6(1):71–85. - PubMed
-
- Bissegger MR. The Evanston Initial Decision: Is There a Future for Patient Flow Analysis? Journal of Health Law. 2006;39(1):143–59. - PubMed
MeSH terms
LinkOut - more resources
Full Text Sources
Miscellaneous
