

The endogenous cannabinoid, anandamide, inhibits dopamine transporter function by a receptor-independent mechanism
- PMID: 20050977
- PMCID: PMC2951136
- DOI: 10.1111/j.1471-4159.2009.06557.x
The endogenous cannabinoid, anandamide, inhibits dopamine transporter function by a receptor-independent mechanism
Abstract
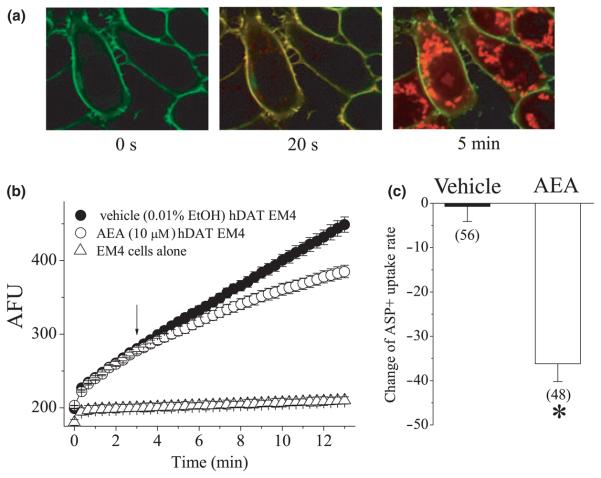
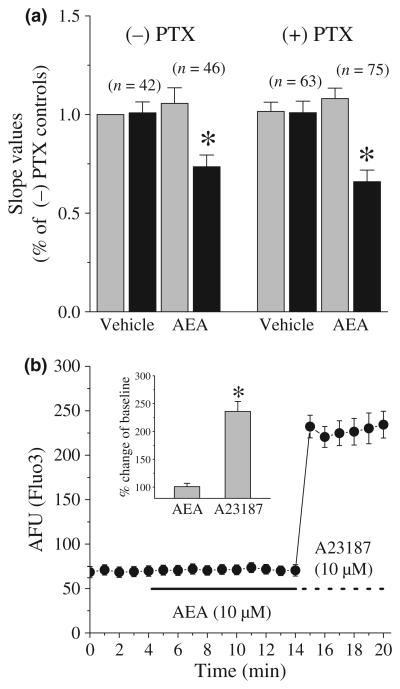
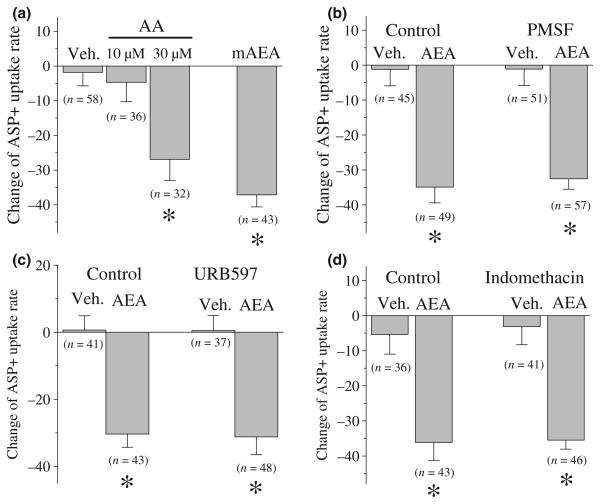
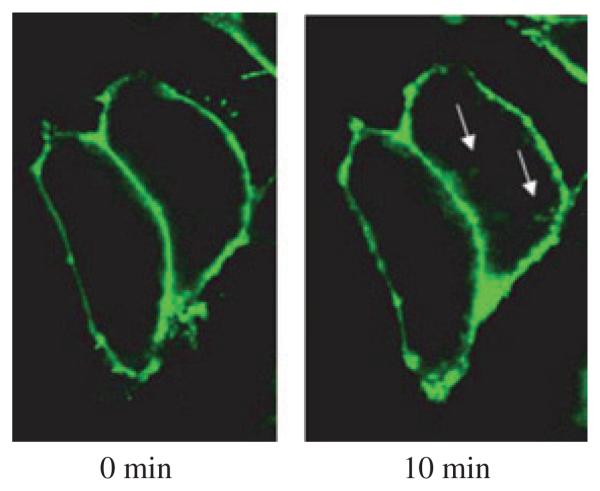
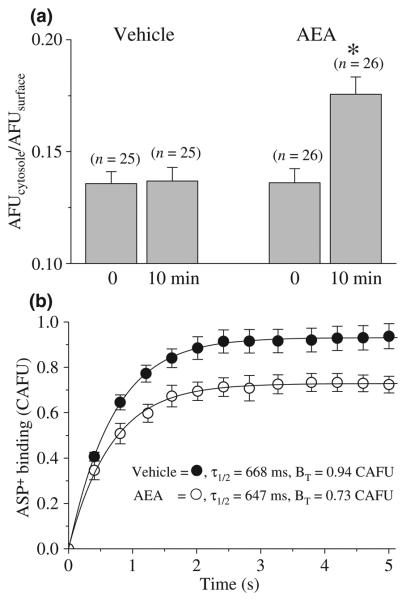
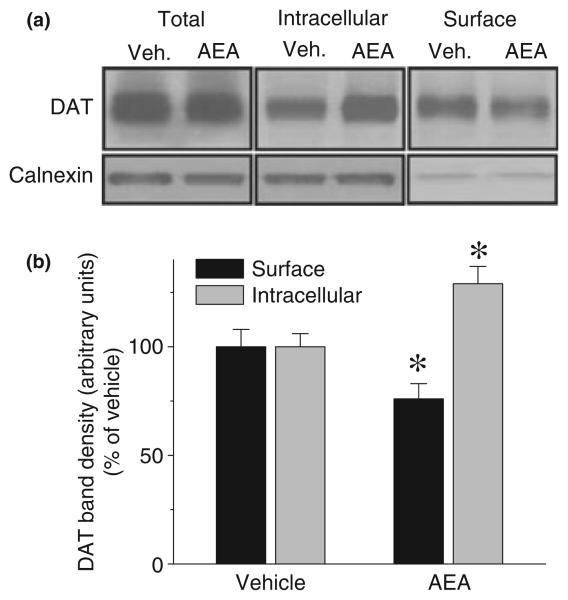
The endocannabinoid, anandamide (AEA), modulates the activity of the dopamine transporter (DAT) in heterologous cells and synaptosomal preparations. The cellular mechanisms mediating this effect are unknown. The present studies employed live cell imaging techniques and the fluorescent, high affinity DAT substrate, 4-(4-(dimethylamino)-styryl)-N-methylpyridinium (ASP(+)), to address this issue. AEA addition to EM4 cells expressing yellow fluorescent protein-tagged human DAT (hDAT) produced a concentration-dependent inhibition of ASP(+) accumulation (IC(50): 3.2 +/- 0.8 microM). This effect occurred within 1 min after AEA addition and persisted for 10 min thereafter. Pertussis toxin did not attenuate the effects of AEA suggesting a mechanism independent of G(i)/G(o) coupled receptors. The amidohydrolase inhibitor, phenylmethylsulfonyl fluoride (0.2 mM), failed to alter the AEA-evoked inhibition of ASP(+) accumulation. Methanandamide (10 microM), a metabolically stable analogue of AEA inhibited accumulation but arachidonic acid (10 microM) was without effect suggesting that the effects of AEA are not mediated by its metabolic products. The extent of AEA inhibition of ASP(+) accumulation was not altered in cells pre-treated with 1 microM URB597, a specific and potent fatty acid amide hydrolase inhibitor, and the cyclooxygenase inhibitor, indomethacin (5 microM) Live cell imaging revealed a significant redistribution of hDAT from the membrane to the cytosol in response to AEA treatment (10 microM; 10 min). Similarly biotinylation experiments revealed that the decrease in DAT function was associated with a reduction in hDAT cell surface expression. These results demonstrate that AEA modulates DAT function via a cannabinoid receptor-independent mechanism and suggest that AEA may produces this effect, in part, by modulating DAT trafficking.
Figures

Similar articles
-
Effects of endogenous cannabinoid anandamide on cardiac Na⁺/Ca²⁺ exchanger.Cell Calcium. 2014 May;55(5):231-7. doi: 10.1016/j.ceca.2014.02.017. Epub 2014 Mar 11. Cell Calcium. 2014. PMID: 24674601
-
Endothelium-dependent metabolism by endocannabinoid hydrolases and cyclooxygenases limits vasorelaxation to anandamide and 2-arachidonoylglycerol.Br J Pharmacol. 2007 Mar;150(5):641-51. doi: 10.1038/sj.bjp.0707141. Epub 2007 Jan 22. Br J Pharmacol. 2007. PMID: 17245358 Free PMC article.
-
Endothelium-dependent mechanisms of the vasodilatory effect of the endocannabinoid, anandamide, in the rat pulmonary artery.Pharmacol Res. 2012 Sep;66(3):251-9. doi: 10.1016/j.phrs.2012.05.004. Epub 2012 May 22. Pharmacol Res. 2012. PMID: 22627170
-
Endocannabinoid binding to the cannabinoid receptors: what is known and what remains unknown.Curr Med Chem. 2010;17(14):1468-86. doi: 10.2174/092986710790980005. Curr Med Chem. 2010. PMID: 20166921 Free PMC article. Review.
-
Anandamide transport: a critical review.Life Sci. 2005 Aug 19;77(14):1584-604. doi: 10.1016/j.lfs.2005.05.007. Life Sci. 2005. PMID: 15979096 Review.
Cited by
-
Neuroprotection or Neurotoxicity of Illicit Drugs on Parkinson's Disease.Life (Basel). 2020 Jun 11;10(6):86. doi: 10.3390/life10060086. Life (Basel). 2020. PMID: 32545328 Free PMC article. Review.
-
Cannabinoid-dopamine interaction in the pathophysiology and treatment of CNS disorders.CNS Neurosci Ther. 2010 Jun;16(3):e72-91. doi: 10.1111/j.1755-5949.2010.00144.x. Epub 2010 Apr 12. CNS Neurosci Ther. 2010. PMID: 20406253 Free PMC article. Review.
-
Capsaicin Is a Negative Allosteric Modulator of the 5-HT3 Receptor.Front Pharmacol. 2020 Aug 31;11:1274. doi: 10.3389/fphar.2020.01274. eCollection 2020. Front Pharmacol. 2020. PMID: 32982728 Free PMC article.
-
Cell-Autonomous Excitation of Midbrain Dopamine Neurons by Endocannabinoid-Dependent Lipid Signaling.Neuron. 2017 Mar 22;93(6):1375-1387.e2. doi: 10.1016/j.neuron.2017.02.025. Epub 2017 Mar 2. Neuron. 2017. PMID: 28262417 Free PMC article.
-
Cannabinoid-dopamine interactions in the physiology and physiopathology of the basal ganglia.Br J Pharmacol. 2016 Jul;173(13):2069-79. doi: 10.1111/bph.13215. Epub 2015 Jul 31. Br J Pharmacol. 2016. PMID: 26059564 Free PMC article. Review.
References
-
- Abadji V, Lin S, Taha G, Griffin G, Stevenson LA, Pertwee RG, Makriyannis A. (R)-methanandamide: a chiral novel anandamide possessing higher potency and metabolic stability. J. Med. Chem. 1994;37:1889–1893. - PubMed
-
- Adams IB, Ryan W, Singer M, Thomas BF, Compton DR, Razdan RK, Martin BR. Evaluation of cannabinoid receptor binding and in vivo activities for anandamide analogs. J. Pharmacol. Exp. Ther. 1995;273:1172–1181. - PubMed
-
- Amara SG, Kuhar MJ. Neurotransmitter transporters: recent progress. Annu. Rev. Neurosci. 1993;16:73–93. - PubMed
-
- Bolan EA, Kivell B, Jaligam V, et al. D2 receptors regulate dopamine transporter function via an extracellular signal-regulated kinases 1 and 2-dependent and phosphoinositide 3 kinase-independent mechanism. Mol. Pharmacol. 2007;71:1222–1232. - PubMed
Publication types
MeSH terms
Substances
Grants and funding
LinkOut - more resources
Full Text Sources
