. 2009 Dec;17(6):585-94.
doi: 10.1109/TNSRE.2009.2036615.

A combined sEMG and accelerometer system for monitoring functional activity in stroke

Affiliations

A combined sEMG and accelerometer system for monitoring functional activity in stroke

Serge H Roy et al. IEEE Trans Neural Syst Rehabil Eng. 2009 Dec.

Abstract

Remote monitoring of physical activity using body-worn sensors provides an alternative to assessment of functional independence by subjective, paper-based questionnaires. This study investigated the classification accuracy of a combined surface electromyographic (sEMG) and accelerometer (ACC) sensor system for monitoring activities of daily living in patients with stroke. sEMG and ACC data (eight channels each) were recorded from 10 hemiparetic patients while they carried out a sequence of 11 activities of daily living (identification tasks), and 10 activities used to evaluate misclassification errors (nonidentification tasks). The sEMG and ACC sensor data were analyzed using a multilayered neural network and an adaptive neuro-fuzzy inference system to identify the minimal sensor configuration needed to accurately classify the identification tasks, with a minimal number of misclassifications from the nonidentification tasks. The results demonstrated that the highest sensitivity and specificity for the identification tasks was achieved using a subset of four ACC sensors and adjacent sEMG sensors located on both upper arms, one forearm, and one thigh, respectively. This configuration resulted in a mean sensitivity of 95.0%, and a mean specificity of 99.7% for the identification tasks, and a mean misclassification error of < 10% for the nonidentification tasks. The findings support the feasibility of a hybrid sEMG and ACC wearable sensor system for automatic recognition of motor tasks used to assess functional independence in patients with stroke.


Figures
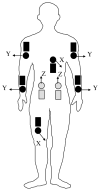
Fig. 1
Fig. 1
Schematic overview of the location of ACC (dark round) and sEMG (dark rectangular) sensors on a frontal view of the subject. Lightly shaded sensors indicate posterior placement on the subject. The directions for measurement of acceleration by each accelerometer are indicated by arrows where X refers to the anterior-posterior direction, Y refers to the medial–lateral direction, and Z refers to the superior–inferior (gravity) direction.
Fig. 2
Fig. 2
Schematic diagram showing each stage of the data processing system for activity classification, based on earlier work [17]. Raw sEMG and ACC signals provide the input into the system, which culminates in the output classification of 11 identification tasks. Feature extraction parameters describe various characteristics of the input signals related to muscle activity and movement. The features serve as inputs to a neural network, which is trained to identify the identification tasks. The output is directed to an adaptive neuro-fuzzy inference system which identifies whether the outputs of the neural networks resembled the orthogonal pattern expected of an identification task, or the nonorthogonal pattern of a nonidentification task.
Fig. 3
Fig. 3
(a) Example of raw sEMG and ACC data from one of the subjects tested in this study. Twenty seconds of data are displayed for a subset of sensors placed on the upper extremity (sEMG sensors located on the biceps brachii and wrist flexor muscles, respectively; ACC sensors located immediately adjacent to the sEMG sensors). Data were recorded for two identification tasks (shirt buttoning and hair combing) and one nonidentification task (bringing a telephone receiver to the ear). (b) A similar data set from a second subject performing the same tasks as in (a).
Fig. 4
Fig. 4
ROC curves for neural networks with different topologies. Results are for algorithms trained using 250 iterations. The left panel is a plot of sensitivity versus misclassification; the right panel is a plot of sensitivity versus specificity. Dashed lines with and without squares represent two-layer neural networks with 22 and 33 neurons in the hidden layer, respectively. Continuous line plots with and without circles represent three-layer neural networks with either 44 and 33 neurons in the first and second hidden layers or 44 and 22 neurons in the first and second layer, respectively.
Fig. 5
Fig. 5
ROC curves for classification of the identification and nonidentification tasks for data from all 16 sensors (eight sEMG plus eight ACC; solid line), from just the eight ACC sensors (dash/dot line) and from just the eight sEMG sensors (dotted line). Results were derived from all of the subject data using an ANN with a three-layer neural network with 44 and 22 neurons in the hidden layers and an ANFIS.
Fig. 6
Fig. 6
ROC curves for data from different numbers of ACC sensors used in the analysis. Each ROC curve represents the best performance for a specified number of sensors when all possible combinations of that number of sensors were analyzed using the ANN algorithm. The curves demonstrate that classification performance, in general, is reduced by decreasing the number of ACC sensor. Secondly, these results demonstrate that reducing the number of sensors to fewer than 4 results in a dramatic reduction in sensitivity, particularly when the goal of limiting misclassifications to 10% is enforced.
Fig. 7
Fig. 7
Comparison of ROC curves for data from four hybrid sensors (dashed line) versus data from four ACC sensors (solid line). Results are for the set of sensors with data that produced the highest % sensitivity and % specificity. The findings demonstrate that classification of these tasks can be improved with a hybrid sensor that combines sEMG and ACC detection.

References

    1. Heart Disease and Stroke Statistics—2005 Update. Dallas, Tx: Amer. Heart Assoc; 2005.
    1. CDC. Prevalence of disabilities and associated health conditions among adults—United states. MMWR. 2001;50:120–125. - PubMed
    1. Lieberman JR, Dorey F, Shekelle P. Difference between patients’ and physicians’ evaluations of outcome after total hip arthroplasty. J Bone Joint Surg. 1996;78:835–838. - PubMed
    1. Reuben DB. What’s wrong with ADLs? J Am Geriatr Soc. 1995;43:936–937. - PubMed
    1. Kiani K, Snijders CJ, Gelsema ES. Computerized analysis of daily life motor activity for ambulatory monitoring. Technol Health Care. 1997;5:307–318. - PubMed

Publication types

MeSH terms