

Face-identity change activation outside the face system: "release from adaptation" may not always indicate neuronal selectivity
- PMID: 20051364
- PMCID: PMC2950811
- DOI: 10.1093/cercor/bhp272
Face-identity change activation outside the face system: "release from adaptation" may not always indicate neuronal selectivity
Abstract
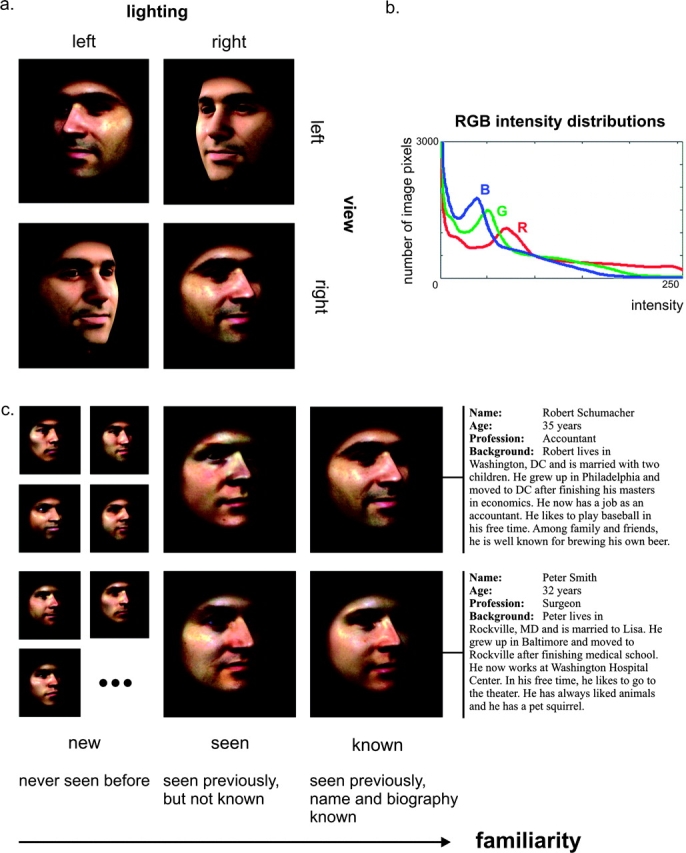
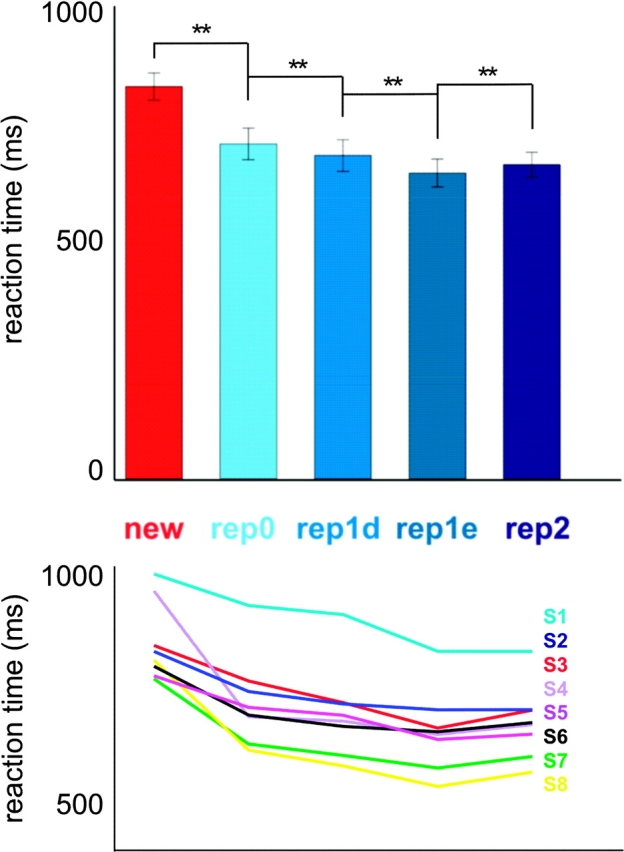
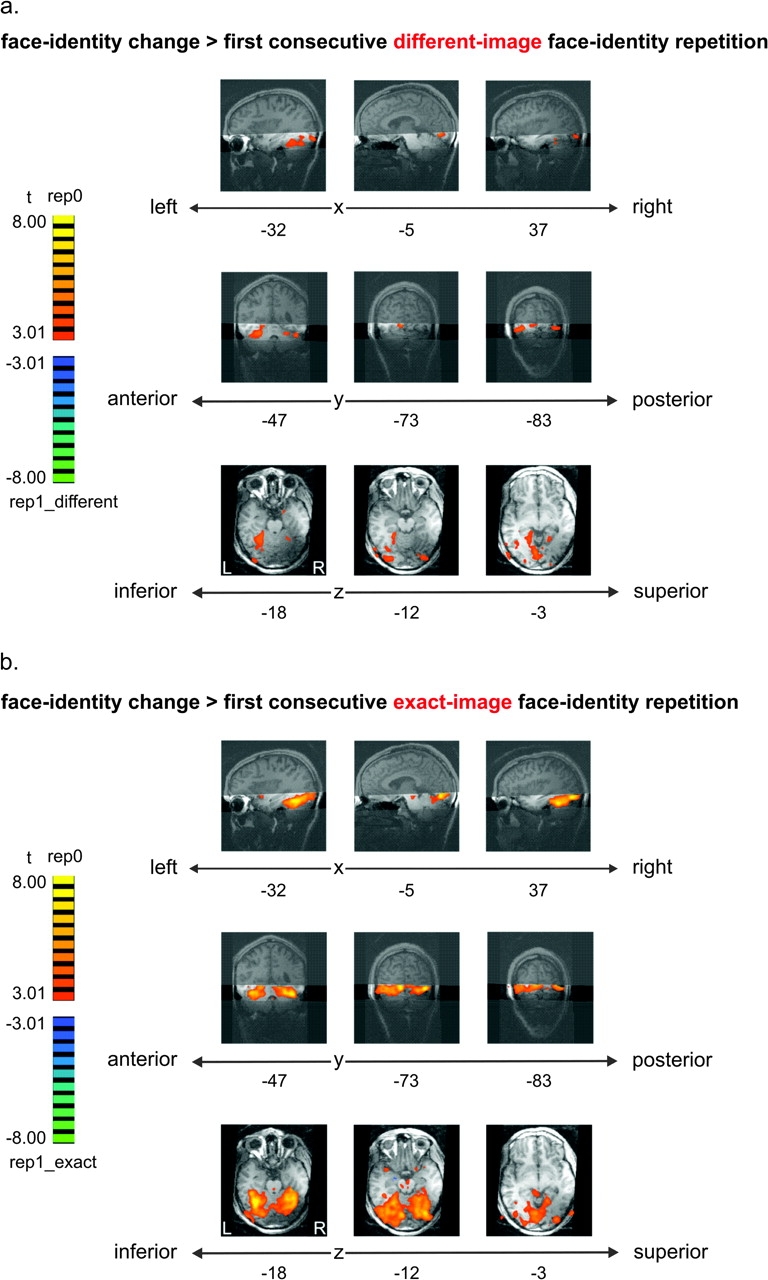
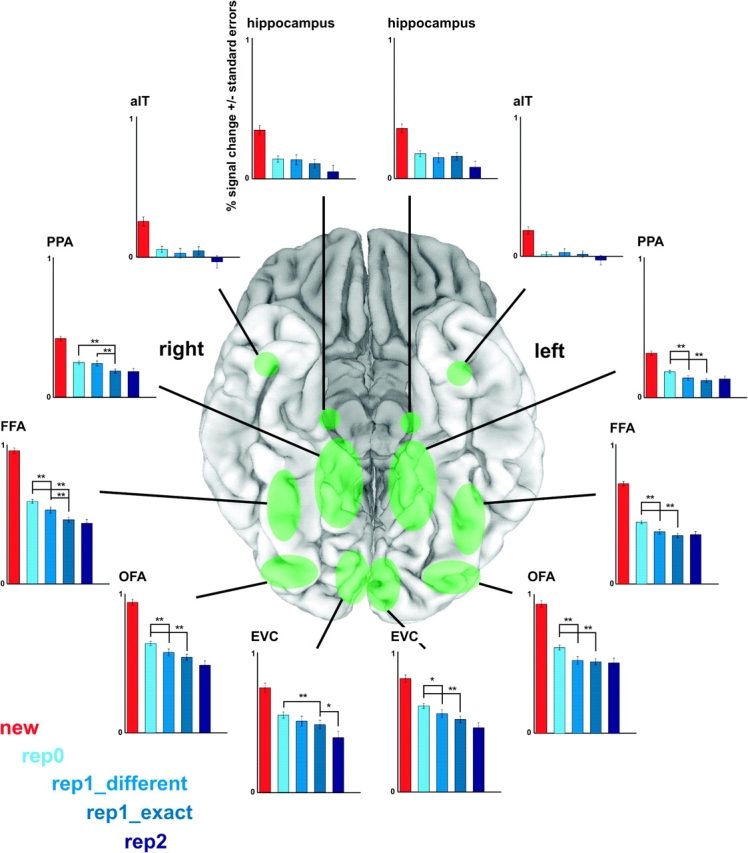
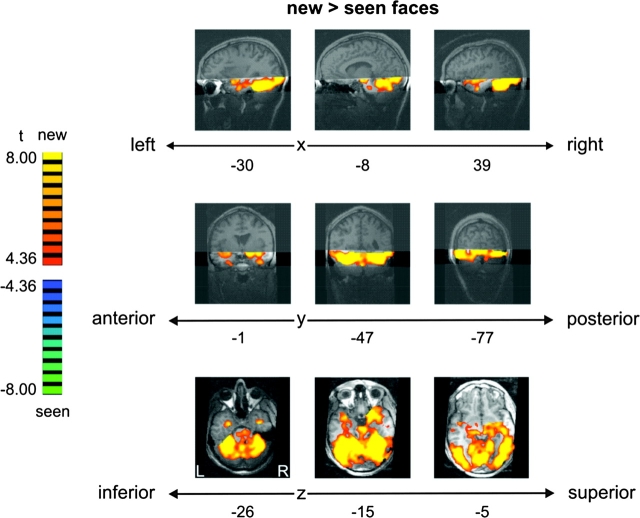
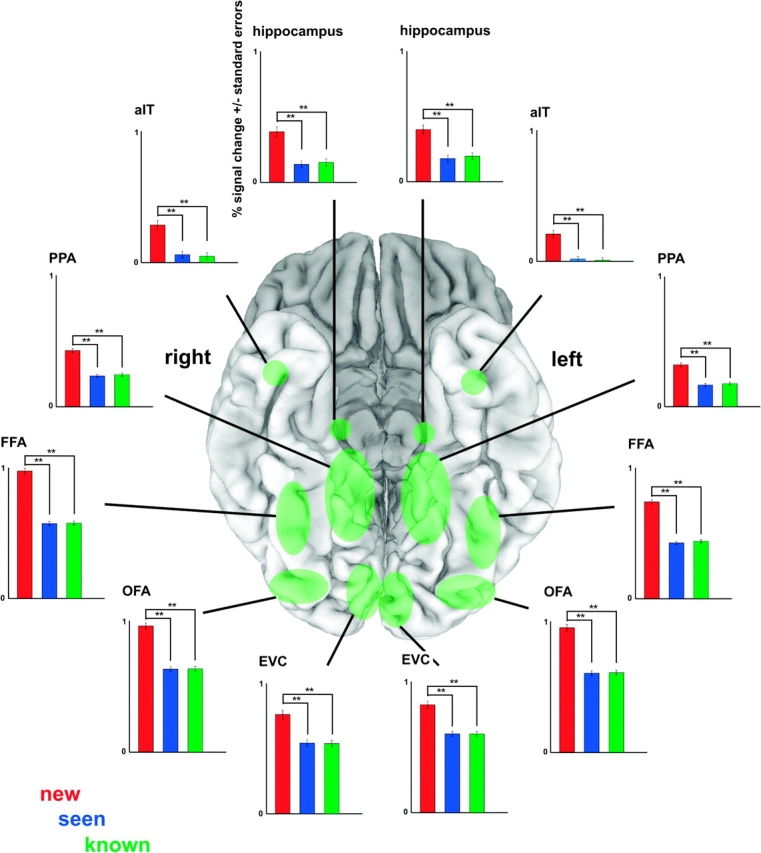
Face recognition is a complex cognitive process that requires distinguishable neuronal representations of individual faces. Previous functional magnetic resonance imaging (fMRI) studies using the "fMRI-adaptation" technique have suggested the existence of face-identity representations in face-selective regions, including the fusiform face area (FFA). Here, we present face-identity adaptation findings that are not well explained in terms of face-identity representations. We performed blood-oxygen level-dependent (BOLD) fMRI measurements, while participants viewed familiar faces that were shown repeatedly throughout the experiment. We found decreased activation for repeated faces in face-selective regions, as expected based on previous studies. However, we found similar effects in regions that are not face-selective, including the parahippocampal place area (PPA) and early visual cortex (EVC). These effects were present for exact-image (same view and lighting) as well as different-image (different view and/or lighting) repetition, but more widespread for exact-image repetition. Given the known functional properties of PPA and EVC, it appears unlikely that they contain domain-specific face-identity representations. Alternative interpretations include general attentional effects and carryover of activation from connected regions. These results remind us that fMRI stimulus-change effects can have a range of causes and do not provide conclusive evidence for a neuronal representation of the changed stimulus property.
Figures
Similar articles
-
Effects of face repetition on ventral visual stream connectivity using dynamic causal modelling of fMRI data.Neuroimage. 2022 Dec 1;264:119708. doi: 10.1016/j.neuroimage.2022.119708. Epub 2022 Oct 21. Neuroimage. 2022. PMID: 36280098
-
Failing to ignore: paradoxical neural effects of perceptual load on early attentional selection in normal aging.J Neurosci. 2010 Nov 3;30(44):14750-8. doi: 10.1523/JNEUROSCI.2687-10.2010. J Neurosci. 2010. PMID: 21048134 Free PMC article.
-
Attentional modulation of repetition attenuation is anatomically dissociable for scenes and faces.Brain Res. 2006 Mar 29;1080(1):53-62. doi: 10.1016/j.brainres.2006.01.090. Epub 2006 Feb 28. Brain Res. 2006. PMID: 16507300
-
Category-specific organization of prefrontal response-facilitation during priming.Neuropsychologia. 2006;44(10):1765-76. doi: 10.1016/j.neuropsychologia.2006.03.019. Epub 2006 May 15. Neuropsychologia. 2006. PMID: 16701731
-
Distinct but Overlapping Patterns of Response to Words and Faces in the Fusiform Gyrus.Cereb Cortex. 2016 Jul;26(7):3161-8. doi: 10.1093/cercor/bhv147. Epub 2015 Jul 8. Cereb Cortex. 2016. PMID: 26157025 Free PMC article.
Cited by
-
Local discriminability determines the strength of holistic processing for faces in the fusiform face area.Front Psychol. 2013 Jan 8;3:604. doi: 10.3389/fpsyg.2012.00604. eCollection 2012. Front Psychol. 2013. PMID: 23316180 Free PMC article.
-
Single-unit recordings in the macaque face patch system reveal limitations of fMRI MVPA.J Neurosci. 2015 Feb 11;35(6):2791-802. doi: 10.1523/JNEUROSCI.4037-14.2015. J Neurosci. 2015. PMID: 25673866 Free PMC article.
-
Decoding actions at different levels of abstraction.J Neurosci. 2015 May 20;35(20):7727-35. doi: 10.1523/JNEUROSCI.0188-15.2015. J Neurosci. 2015. PMID: 25995462 Free PMC article.
-
Adaptation and visual coding.J Vis. 2011 May 20;11(5):10.1167/11.5.3 3. doi: 10.1167/11.5.3. J Vis. 2011. PMID: 21602298 Free PMC article. Review.
-
Explicating the face perception network with white matter connectivity.PLoS One. 2013 Apr 22;8(4):e61611. doi: 10.1371/journal.pone.0061611. Print 2013. PLoS One. 2013. PMID: 23630602 Free PMC article.
References
-
- Aguirre GK, D'Esposito M. Topographical disorientation: a synthesis and taxonomy. Brain. 1999;122:1613–1628. - PubMed
-
- Andrews TJ, Ewbank MP. Distinct representations for facial identity and changeable aspects of faces in the human temporal lobe. Neuroimage. 2004;23:905–913. - PubMed
-
- Anzai A, Peng X, Van Essen DC. Neurons in monkey visual area V2 encode combinations of orientations. Nat Neurosci. 2007;10:1313–1321. - PubMed
-
- Avidan G, Hasson U, Hendler T, Zohary E, Malach R. Analysis of the neuronal selectivity underlying low fMRI signals. Curr Biol. 2002;12:964–972. - PubMed
