Clinical Trial
. 2010 Jan;3(1):35-47.
doi: 10.1158/1940-6207.CAPR-09-0096.

A randomized, double-blind, placebo-controlled phase 3 skin cancer prevention study of {alpha}-difluoromethylornithine in subjects with previous history of skin cancer

Affiliations
Clinical Trial

A randomized, double-blind, placebo-controlled phase 3 skin cancer prevention study of {alpha}-difluoromethylornithine in subjects with previous history of skin cancer

Howard H Bailey et al. Cancer Prev Res (Phila). 2010 Jan.

Abstract

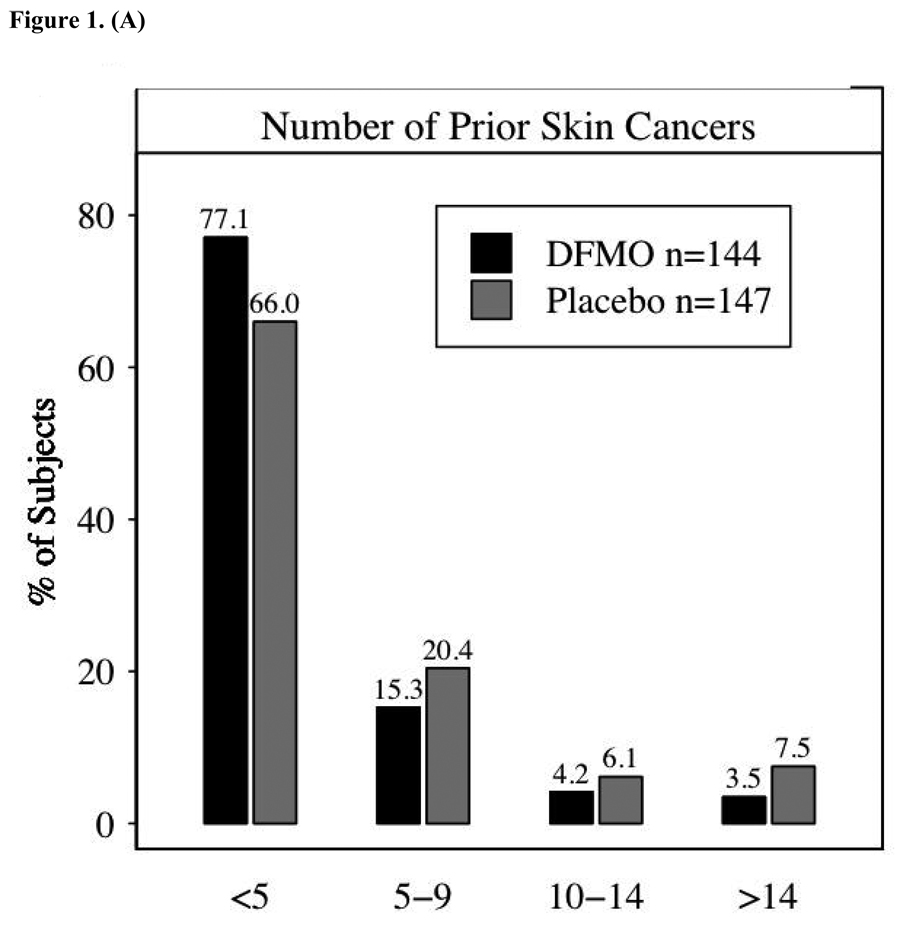
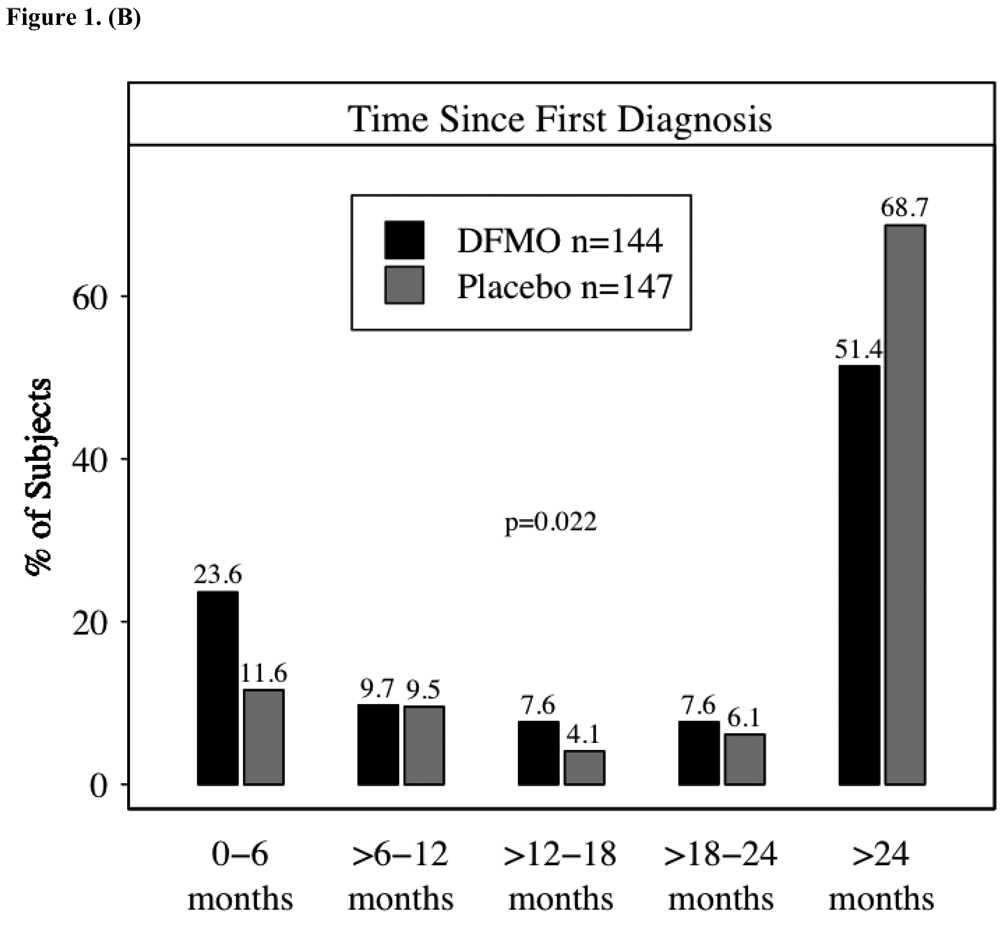
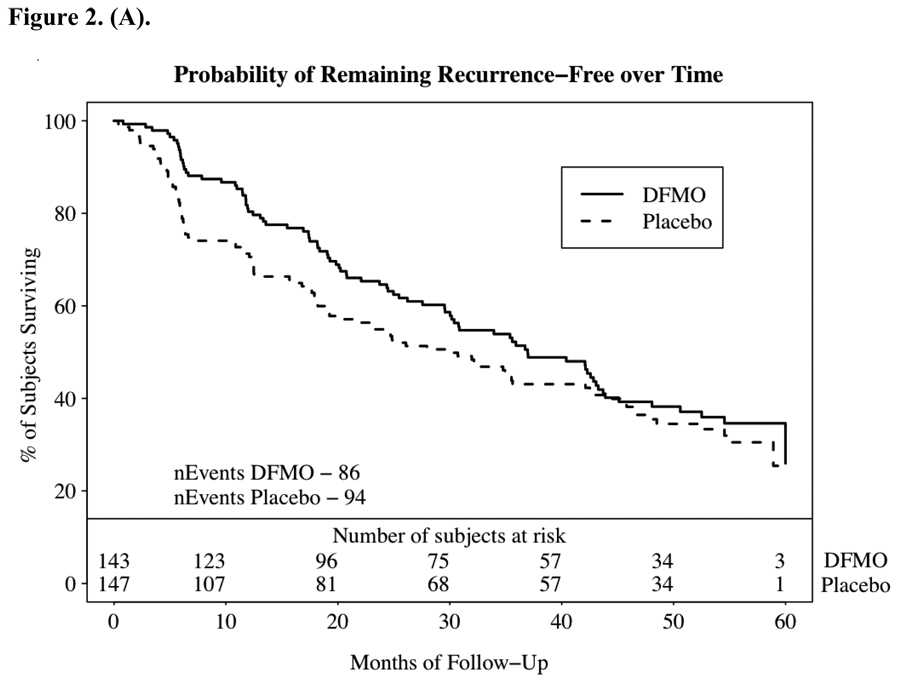
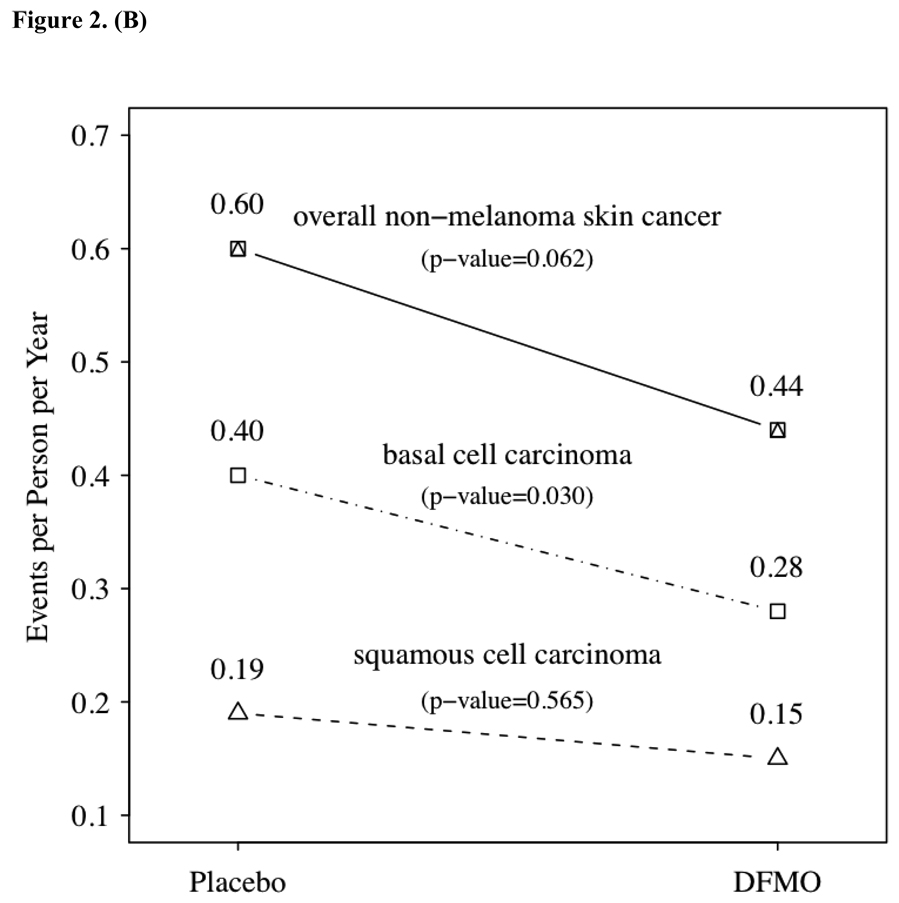
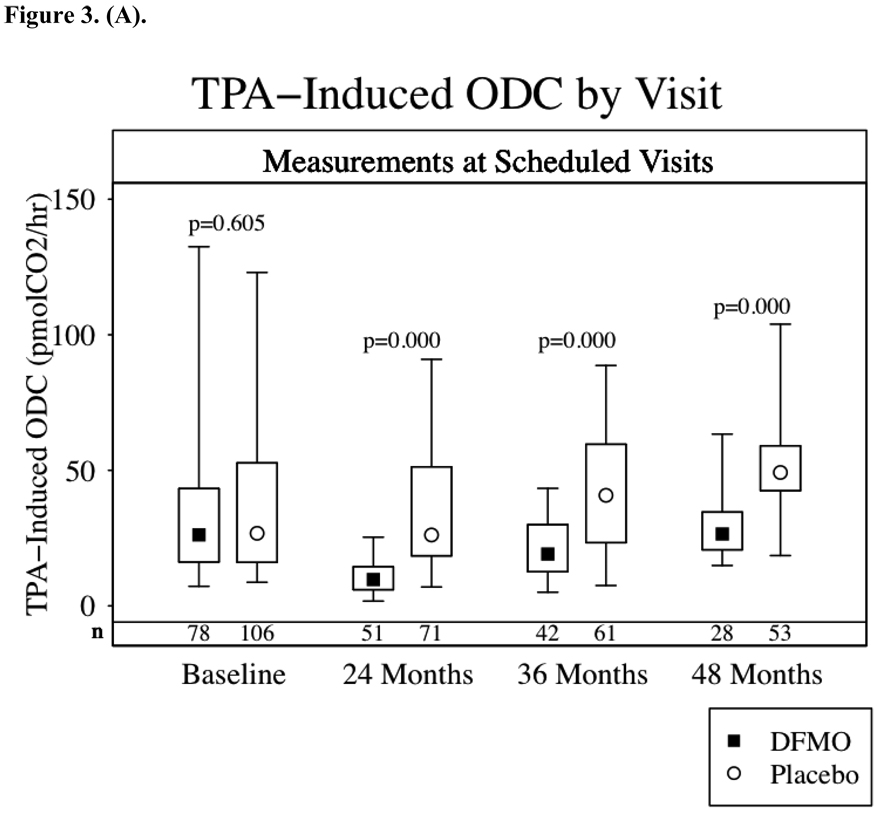
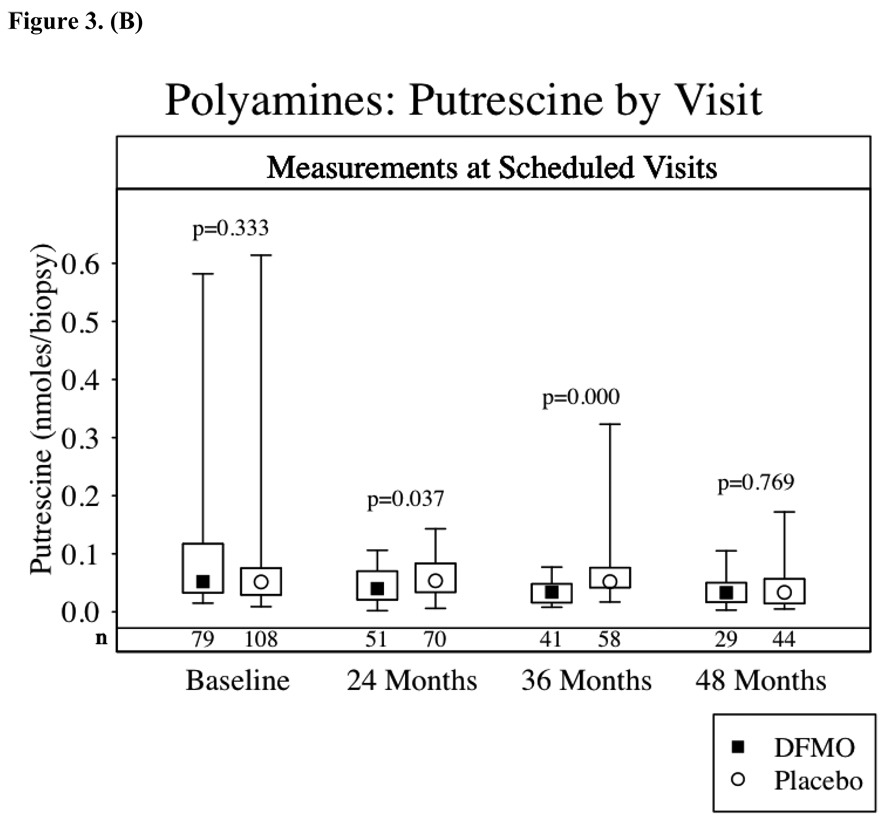
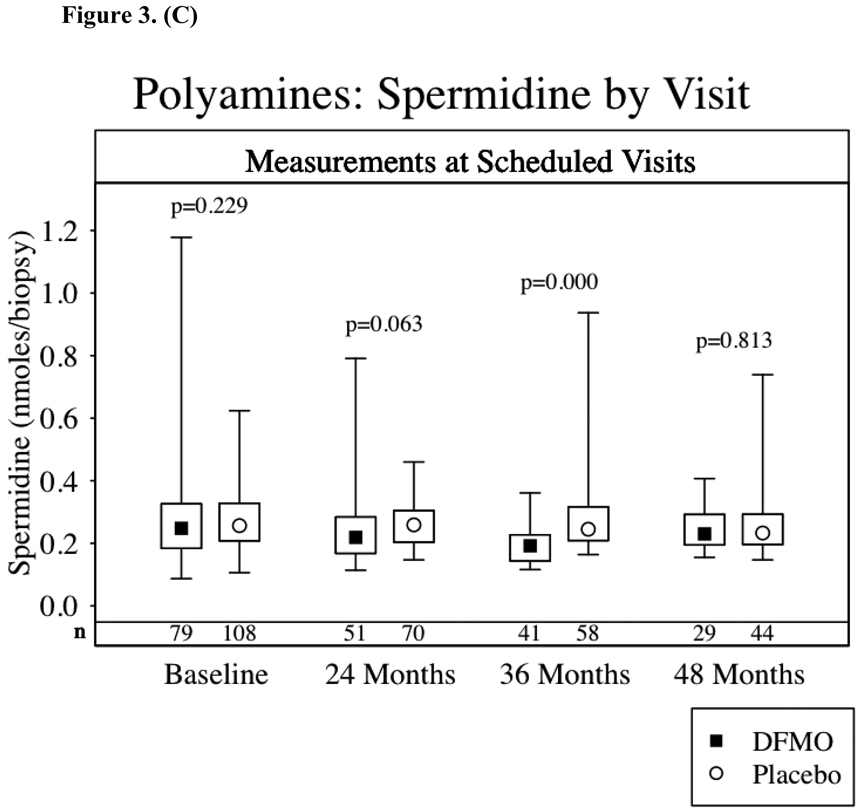
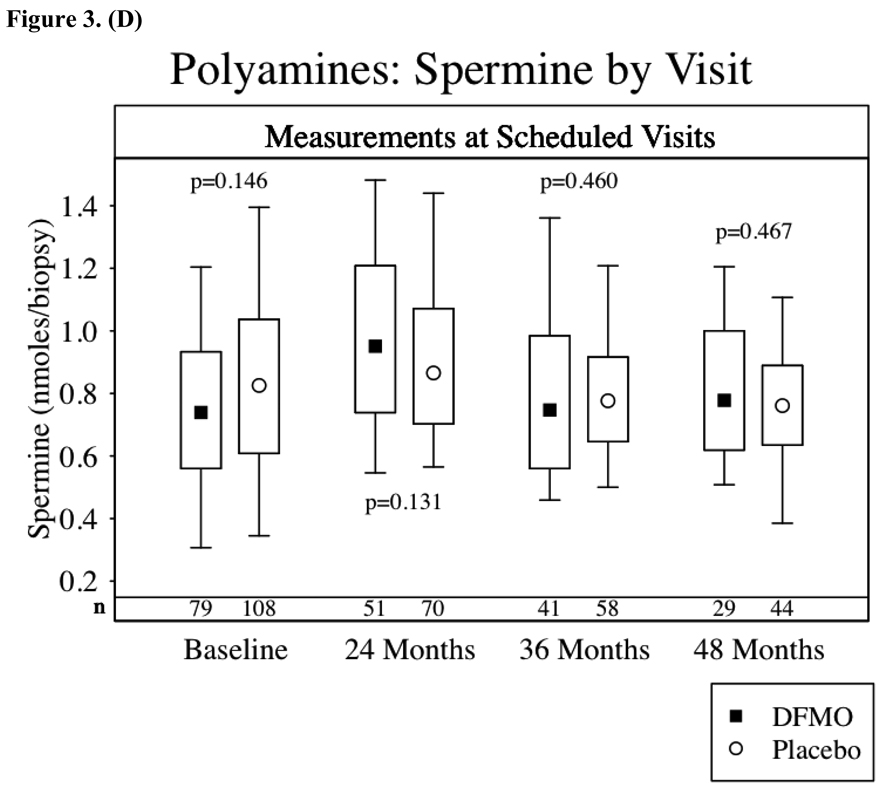
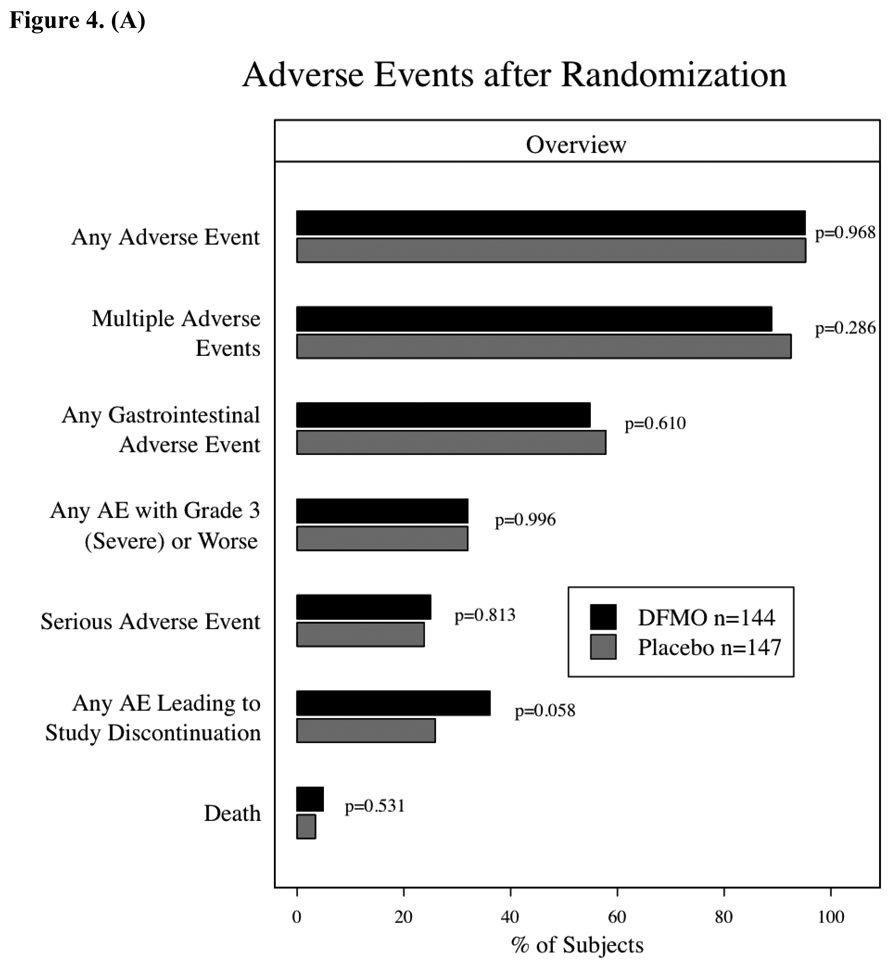
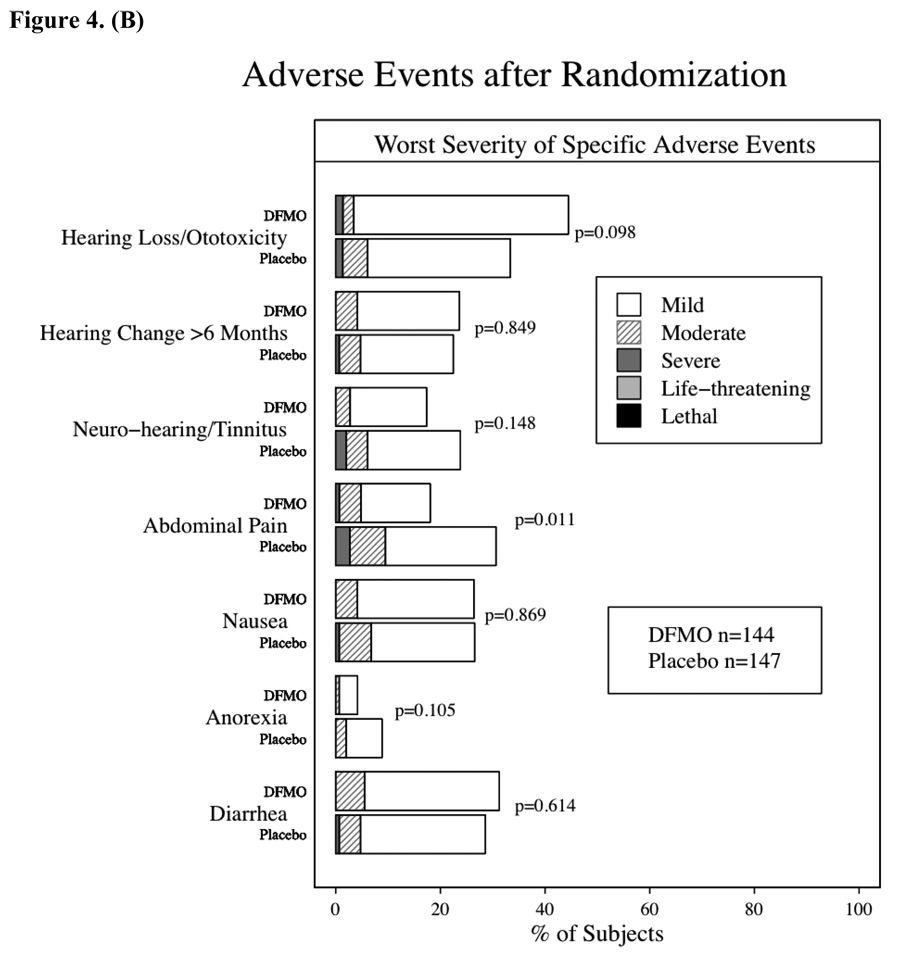
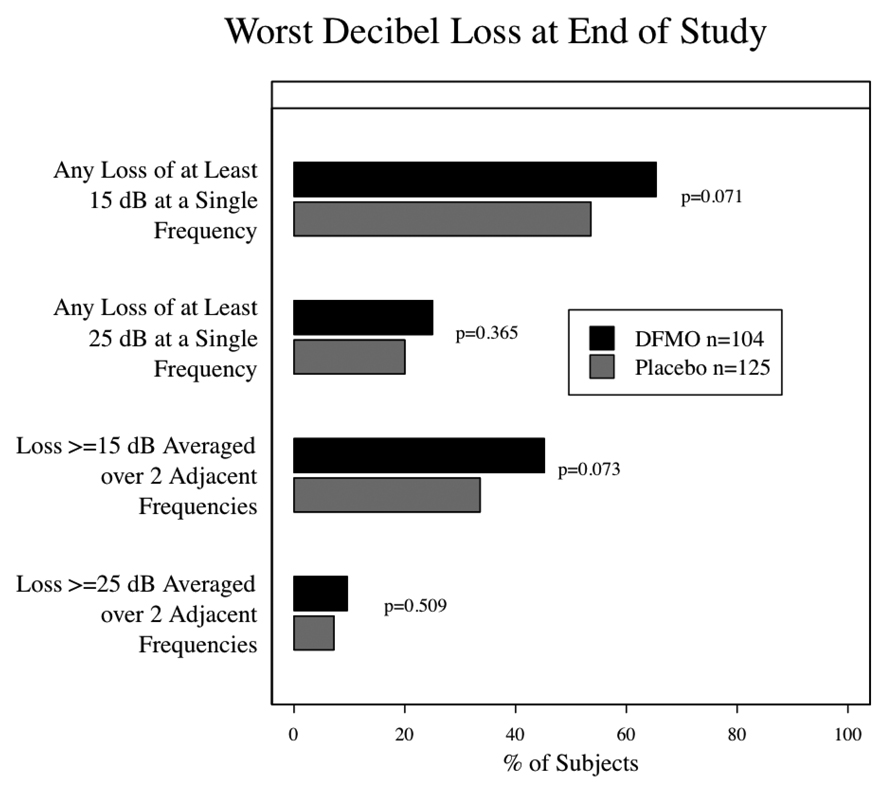
Preclinical studies have shown that the inhibition of ornithine decarboxylase (ODC) by alpha-difluoromethylornithine (DFMO) and resultant decreases in tissue concentrations of polyamines (putrescine and spermidine) prevents neoplastic developments in many tissue types. Clinical studies of oral DFMO at 500 mg/m(2)/day revealed it to be safe and tolerable and resulted in significant inhibition of phorbol ester-induced skin ODC activity. Two hundred and ninety-one participants (mean age, 61 years; 60% male) with a history of prior nonmelanoma skin cancer (NMSC; mean, 4.5 skin cancers) were randomized to oral DFMO (500 mg/m(2)/day) or placebo for 4 to 5 years. There was a trend toward a history of more prior skin cancers in subjects randomized to placebo, but all other characteristics including sunscreen and nonsteroidal anti-inflammatory drug use were evenly distributed. Evaluation of 1,200 person-years of follow-up revealed a new NMSC rate of 0.5 events/person/year. The primary end point, new NMSCs, was not significantly different between subjects taking DFMO and placebo (260 versus 363 cancers, P = 0.069, two-sample t test). Evaluation of basal cell (BCC) and squamous cell cancers separately revealed very little difference in squamous cell cancer between treatment groups but a significant difference in new BCC (DFMO, 163 cancers; placebo, 243 cancers; expressed as event rate of 0.28 BCC/person/year versus 0.40 BCC/person/year, P = 0.03). Compliance with DFMO was >90% and it seemed to be well tolerated with evidence of mild ototoxicity as measured by serial audiometric examination when compared with placebo subjects. The analysis of normal skin biopsies revealed a significant (P < 0.05) decrease in 12-0-tetradecanoylphorbol-13-acetate-induced ODC activity (month 24, 36, and 48) and putrescine concentration (month 24 and 36 only) in DFMO subjects. Subjects with a history of skin cancer taking daily DFMO had an insignificant reduction (P = 0.069) in new NMSC that was predominantly due to a marked reduction in new BCC. Based on these data, the potential of DFMO, alone or in combination, to prevent skin cancers should be explored further.


Figures

Figure 1
Figure 1
1a – Number of prior skin cancers per subject; 1b – Duration in months from first skin cancer to study enrollment. The difference between the groups was assessed using the Wilcoxon rank- sum test.
Figure 1
Figure 1
1a – Number of prior skin cancers per subject; 1b – Duration in months from first skin cancer to study enrollment. The difference between the groups was assessed using the Wilcoxon rank- sum test.
Figure 2
Figure 2
2a – Probability of remaining recurrence free over time as indicated by the Kaplan-Meier estimator. Time to first non-melanoma skin cancer (NMSC) in study. Time to first diagnosis was computed from the date of first new skin cancer diagnosis after randomization, and the randomization date. Panel displays a Kaplan-Meier curve of the probability of remaining recurrence-free over time. Numbers at the bottom are the number of subjects per treatment group still at risk. Patients with no new skin cancers reported were censored at the date of the last study visit in the follow-up database: 2b – non-melanoma skin cancer event rate by treatment group and histology. P values were obtained from over dispersed Poisson models considering the cumulative counts of new cancer over time within each subject, with treatment as the independent variable.
Figure 2
Figure 2
2a – Probability of remaining recurrence free over time as indicated by the Kaplan-Meier estimator. Time to first non-melanoma skin cancer (NMSC) in study. Time to first diagnosis was computed from the date of first new skin cancer diagnosis after randomization, and the randomization date. Panel displays a Kaplan-Meier curve of the probability of remaining recurrence-free over time. Numbers at the bottom are the number of subjects per treatment group still at risk. Patients with no new skin cancers reported were censored at the date of the last study visit in the follow-up database: 2b – non-melanoma skin cancer event rate by treatment group and histology. P values were obtained from over dispersed Poisson models considering the cumulative counts of new cancer over time within each subject, with treatment as the independent variable.
Figure 3
Figure 3
Skin Biomarkers Box Plots. Median values ▪ ◦, boxes denote first (lower border) and third (upper border) quartiles of the data distribution, and lines/whiskers denote 5th (lower) and 95th (upper) percentile of the distribution. The differences between the groups were assessed using the Wilcoxon rank-sum test. Lower numbers (n) are the number of subjects with skin samples for analysis per treatment group. 3a-TPA-Induced skin ODC activity, 3b-skin putrescine concentrations, 3c-skin spermidine concentrations and 3d-skin spermidine.
Figure 3
Figure 3
Skin Biomarkers Box Plots. Median values ▪ ◦, boxes denote first (lower border) and third (upper border) quartiles of the data distribution, and lines/whiskers denote 5th (lower) and 95th (upper) percentile of the distribution. The differences between the groups were assessed using the Wilcoxon rank-sum test. Lower numbers (n) are the number of subjects with skin samples for analysis per treatment group. 3a-TPA-Induced skin ODC activity, 3b-skin putrescine concentrations, 3c-skin spermidine concentrations and 3d-skin spermidine.
Figure 4
Figure 4
Adverse events after randomization. The differences between the groups were assessed using chi-square tests. 4a – Overview of Adverse Events after randomization. 4b – Incidence of specific, more common toxicities by treatment group and severity (mild – grade 1, moderate – grade 2, severe – grade 3, life-threatening – grade 4, lethal – grade 5).
Figure 4
Figure 4
Adverse events after randomization. The differences between the groups were assessed using chi-square tests. 4a – Overview of Adverse Events after randomization. 4b – Incidence of specific, more common toxicities by treatment group and severity (mild – grade 1, moderate – grade 2, severe – grade 3, life-threatening – grade 4, lethal – grade 5).
Figure 5
Figure 5
End of Study Audiometry results by treatment group. The panel summarizes the worst change for each subject according to certain thresholds. The differences between the groups were assessed using the Wilcoxon rank-sum test.

Comment in

References

    1. Jemal A, Siegel R, Ward E, et al. Cancer statistics, 2008. CA Cancer J Clin. 2008;58:71–96. - PubMed
    1. Chen J, Fleisher AB, Jr, Smith ED, et al. Cost of non-melanoma skin cancer treatment in the United States. Dermatol Surg. 2001;27:1035–1038. - PubMed
    1. Lindelof B, Sigurgeirsson B, Gabel H, Stern RS. Incidence of skin cancer in 5356 patients following organ transplantation. Br J Dermatol. 2000;143(3):513–519. - PubMed
    1. Ramsay HM, Reece SM, Fryer AA, et al. Seven-year prospective study of non-melanoma skin cancer incidence in U.K. renal transplant recipients. Transplantation. 2007;84:437–439. - PubMed
    1. Bath-Hextall FJ, Leonardi-Bee J, Somchand N, Webster AC, Delitt J, Perkins W. Interventions for preventing non-melanoma skin cancers in high-risk groups. Cochrane Database Syst Rev. 2007;(Issue 4) Art. No.: CD005414. - PMC - PubMed

Publication types