Persistent induction of cytochrome P4501A1 in human hepatoma cells by 3-methylcholanthrene: evidence for sustained transcriptional activation of the CYP1A1 promoter
- PMID: 20051482
- PMCID: PMC2846024
- DOI: 10.1124/jpet.109.162222
Persistent induction of cytochrome P4501A1 in human hepatoma cells by 3-methylcholanthrene: evidence for sustained transcriptional activation of the CYP1A1 promoter
Abstract
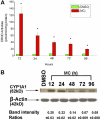
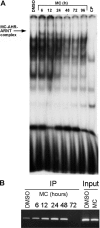
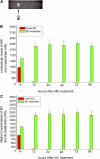
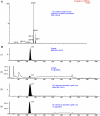
Cytochrome P450 (P450)1A1 plays a critical role in the metabolic activation and detoxification of polycyclic aromatic hydrocarbons (PAHs), many of which are potent human carcinogens. In this investigation, we tested the hypothesis that MC elicits persistent induction of CYP1A1 expression in human hepatoma cells (HepG2) and that this phenomenon is mediated by sustained transcriptional activation of the CYP1A1 promoter. Treatment of HepG2 cells with MC resulted in marked induction (8-20-fold) of ethoxyresorufin O-de-ethylase activities, CYP1A1 apoprotein contents, and mRNA levels, which persisted for up to 96 h. MC also caused sustained transcriptional activation of the human CYP1A1 promoter for up to 96 h, as inferred from transient transfection experiments. Experiments with deletion constructs indicated that Ah response elements located at -886, -974, and -1047, but not -491, nucleotides from the start site, contributed to the sustained transcriptional activation of the CYP1A1 promoter. Electrophoretic mobility-shift and chromatin immunoprecipitation assays suggested that prolonged CYP1A1 induction was mediated by Ah receptor (AHR)-independent mechanisms. Experiments with [3H]MC and liquid chromatography-tandem mass spectrometry demonstrated rapid elimination of MC and its metabolites from the cells by 12 to 24 h, suggesting that these compounds did not elicit sustained CYP1A1 induction via the classical AHR-mediated pathway. In conclusion, the results of this study support the hypothesis that MC causes persistent induction of CYP1A1 in human hepatoma cells by mechanisms entailing sustained transcriptional activation of the CYP1A1 promoter via AHR-independent mechanisms. These observations have important implications for human carcinogenesis mediated by PAHs.
Figures


Similar articles
-
Disruption of the gene for CYP1A2, which is expressed primarily in liver, leads to differential regulation of hepatic and pulmonary mouse CYP1A1 expression and augmented human CYP1A1 transcriptional activation in response to 3-methylcholanthrene in vivo.J Pharmacol Exp Ther. 2010 Nov;335(2):369-79. doi: 10.1124/jpet.110.171173. Epub 2010 Aug 23. J Pharmacol Exp Ther. 2010. PMID: 20732958 Free PMC article.
-
Persistent induction of cytochrome P450 (CYP)1A enzymes by 3-methylcholanthrene in vivo in mice is mediated by sustained transcriptional activation of the corresponding promoters.Biochem Biophys Res Commun. 2009 Dec 25;390(4):1419-24. doi: 10.1016/j.bbrc.2009.11.021. Epub 2009 Nov 11. Biochem Biophys Res Commun. 2009. PMID: 19900403 Free PMC article.
-
Persistent expression of 3-methylcholanthrene-inducible cytochromes P4501A in rat hepatic and extrahepatic tissues.J Pharmacol Exp Ther. 2000 Jul;294(1):313-22. J Pharmacol Exp Ther. 2000. PMID: 10871328
-
Polycyclic aromatic hydrocarbon-inducible DNA adducts: evidence by 32P-postlabeling and use of knockout mice for Ah receptor-independent mechanisms of metabolic activation in vivo.Int J Cancer. 2003 Jan 1;103(1):5-11. doi: 10.1002/ijc.10784. Int J Cancer. 2003. PMID: 12455047
-
Role of coactivators in transcriptional activation by the aryl hydrocarbon receptor.Arch Biochem Biophys. 2005 Jan 15;433(2):379-86. doi: 10.1016/j.abb.2004.09.031. Arch Biochem Biophys. 2005. PMID: 15581594 Review.
Cited by
-
Disruption of the gene for CYP1A2, which is expressed primarily in liver, leads to differential regulation of hepatic and pulmonary mouse CYP1A1 expression and augmented human CYP1A1 transcriptional activation in response to 3-methylcholanthrene in vivo.J Pharmacol Exp Ther. 2010 Nov;335(2):369-79. doi: 10.1124/jpet.110.171173. Epub 2010 Aug 23. J Pharmacol Exp Ther. 2010. PMID: 20732958 Free PMC article.
-
Sp1, Instead of AhR, Regulates the Basal Transcription of Porcine CYP1A1 at the Proximal Promoter.Front Pharmacol. 2018 Aug 17;9:927. doi: 10.3389/fphar.2018.00927. eCollection 2018. Front Pharmacol. 2018. PMID: 30174605 Free PMC article.
-
Polycyclic Aromatic Hydrocarbon-induced Pulmonary Carcinogenesis in Cytochrome P450 (CYP)1A1- and 1A2-Null Mice: Roles of CYP1A1 and CYP1A2.Toxicol Sci. 2020 Oct 1;177(2):347-361. doi: 10.1093/toxsci/kfaa107. Toxicol Sci. 2020. PMID: 32726451 Free PMC article.
-
An epigenetic memory at the CYP1A gene in cancer-resistant, pollution-adapted killifish.bioRxiv [Preprint]. 2024 Aug 16:2024.08.14.607951. doi: 10.1101/2024.08.14.607951. bioRxiv. 2024. Update in: Sci Rep. 2025 Jan 24;15(1):3033. doi: 10.1038/s41598-024-82740-w. PMID: 39185187 Free PMC article. Updated. Preprint.
-
Polycyclic aromatic hydrocarbons: from metabolism to lung cancer.Toxicol Sci. 2015 May;145(1):5-15. doi: 10.1093/toxsci/kfv040. Toxicol Sci. 2015. PMID: 25911656 Free PMC article. Review.
References
-
- Boobis AR, Nebert DW, Felton JS. (1977) Comparison of beta-naphthoflavone and 3-methylcholanthrene as inducers of hepatic cytochrome(s) P-448 and aryl hydrocarbon (benzo[a]pyrene) hydroxylase activity. Mol Pharmacol 13:259–268 - PubMed
-
- Conney AH. (1986) Induction of microsomal cytochrome P-450 enzymes: the first Bernard B. Brodie lecture at Pennsylvania State University. Life Sci 39:2493–2518 - PubMed
-
- Coumoul X, Diry M, Robillot C, Barouki R. (2001) Differential regulation of cytochrome P450 1A1 and 1B1 by a combination of dioxin and pesticides in the breast tumor cell line MCF-7. Cancer Res 61:3942–3948 - PubMed
Publication types
MeSH terms
Substances
Grants and funding
LinkOut - more resources
Full Text Sources

