. 2010 Mar 5;285(10):7165-75.
doi: 10.1074/jbc.M109.047829. Epub 2010 Jan 5.

Disruption of the K+ channel beta-subunit KCNE3 reveals an important role in intestinal and tracheal Cl- transport

Affiliations

Disruption of the K+ channel beta-subunit KCNE3 reveals an important role in intestinal and tracheal Cl- transport

Patricia Preston et al. J Biol Chem. .

Abstract

The KCNE3 beta-subunit constitutively opens outwardly rectifying KCNQ1 (Kv7.1) K(+) channels by abolishing their voltage-dependent gating. The resulting KCNQ1/KCNE3 heteromers display enhanced sensitivity to K(+) channel inhibitors like chromanol 293B. KCNE3 was also suggested to modify biophysical properties of several other K(+) channels, and a mutation in KCNE3 was proposed to underlie forms of human periodic paralysis. To investigate physiological roles of KCNE3, we now disrupted its gene in mice. kcne3(-/-) mice were viable and fertile and displayed neither periodic paralysis nor other obvious skeletal muscle abnormalities. KCNQ1/KCNE3 heteromers are present in basolateral membranes of intestinal and tracheal epithelial cells where they might facilitate transepithelial Cl(-) secretion through basolateral recycling of K(+) ions and by increasing the electrochemical driving force for apical Cl(-) exit. Indeed, cAMP-stimulated electrogenic Cl(-) secretion across tracheal and intestinal epithelia was drastically reduced in kcne3(-/-) mice. Because the abundance and subcellular localization of KCNQ1 was unchanged in kcne3(-/-) mice, the modification of biophysical properties of KCNQ1 by KCNE3 is essential for its role in intestinal and tracheal transport. Further, these results suggest KCNE3 as a potential modifier gene in cystic fibrosis.


Figures

FIGURE 1.
FIGURE 1.
Generation of kcne3 KO mice. A, strategy for disrupting the mouse kcne3 gene. Top model, WT allele with exons depicted as boxes. Exon 4 contains the entire coding region. Lower models, targeting construct containing a neomycin cassette (neo) as positive and the diphtheria toxin A cassette (dta) and thymidine kinase (tk) as negative selection markers. The neomycin cassette was flanked by loxP sites (◀). A third loxP site was inserted after exon 4. In the recombined allele, the neomycin cassette introduced a new BglI restriction site, giving rise to ∼6- and ∼8-kb BglI restriction fragments. The KO allele (bottom) is obtained by Cre-recombinase mediated excision of exon 4. A ∼9.5-kb BglI restriction fragment (that is shorter than the ∼12-kb fragment of the WT allele; see B) may be detected with 5′ and 3′ probes (bars at bottom) by Southern blotting. B, Southern blot analysis of tail DNA from WT and KO mice using the 5′ probe.
FIGURE 2.
FIGURE 2.
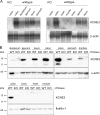
Tissue distribution of KCNE3. A, Northern blot analysis of kcne3 expression. A kcne3-specific band was detected in WT mRNA from colon, duodenum, jejunum, ileum, and stomach but not in brain, heart, and skeletal muscle. Analysis of colonic mRNA from kcne3−/− (KO) mice proved specificity of the kcne3 probe. Hybridization with a β-actin probe was used as loading control. B, Western blot analysis of KCNE3 expression in WT and kcne3−/− tissues. A single KCNE3-immunoreactive band (∼14 kDa) was detected in deglycosylated membrane fractions from duodenum, jejunum, ileum, colon, stomach, and trachea from WT mice but not from KO mice. Deglycosylation proved necessary to obtain a specific, single band (see supplemental Fig. S2). No KCNE3 protein was detected in the brain, heart, and liver of WT mice. α-Actin and flotillin-1 served as loading controls.
FIGURE 3.
FIGURE 3.
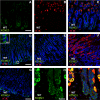
Intestinal expression of KCNE3. A, KCNE3 staining (green) was restricted to basolateral membranes of crypt cells of small intestine. B, lack of KCNE3 staining in kcne3−/− (KO) small intestine. C and D, staining for KCNQ1 (green) does not differ between WT (C) and kcne3−/− (D) small intestine. E and F, KCNE3 resides in basolateral membranes of colonic crypt cells (E) and is absent from KO colon (F). G and H, immunostaining for KCNQ1 (green) in WT colon (G) is similar to that in kcne3−/− colon (H). Counterstaining by Topro-3 (blue). The insets show higher magnifications of regions shown in frames, except for the lower left inset of A that is from a different section and highlights KCNE3 expression in basolateral membranes. The inset scale bar is 5 μm and applies for all insets. The scale bar in A applies also for B–D, the scale bar in E also applies for F, and the scale bar in G also applies for H. These scale bars represent 50 μm.
FIGURE 4.
FIGURE 4.
Localization of KCNE3 in the stomach. A–D, immunostaining for KCNE3 (A, C, and D; green) and H+/K+ ATPase (B–D; red) in gastric mucosa. KCNE3 is found in basolateral membranes of epithelial cells in the basal region of gastric glands that are devoid of the H+/K+ ATPase (A, C, and D). KCNE3 is expressed both in regions with a prominent presence of H+/K+ ATPase-expressing parietal cells (A–C) and in regions lacking those cells (D). E and F, KO controls for specificity of KCNE3 staining in areas lacking (E) or expressing (F) the H+/K+ ATPase. G–I, immunolocalization of KCNQ1 (green) and H+/K+ ATPase (red) in regions lacking (G) or expressing (H and I) the ATPase. KCNQ1 and the ATPase co-localize in parietal cells in a staining pattern broadly covering the cytoplasm. KCNQ1 is additionally present at the bottom of gastric glands in basolateral membranes of cells lacking H+/K+ ATPase (G). These cells express KCNE3 (A–D). KCNQ1 staining was similar in kcne3−/− stomach (data not shown). Counterstaining by Topro-3 (blue). The inset scale bar in D, which shows a higher magnification of the marked area, is 5 μm. The lower right scale bar in D represents 50 μm and also applies to E and F.
FIGURE 5.
FIGURE 5.
Immunolocalization of KCNE3 in tracheal epithelium. A, KCNE3 antibodies stain (in green) basolateral membranes of surface epithelial cells of WT (A) but not kcne3−/− trachea (B). Inset, higher magnification from a different tracheal section. Counterstaining by Topro-3 (blue). The scale bar is 25 μm, and the inset scale bar is 5 μm.
FIGURE 6.
FIGURE 6.
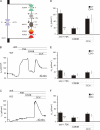
Transepithelial transport across intestinal epithelia of WT and kcne3−/− mice. A, cell model for intestinal Cl secretion by a colonic crypt cell. Driven by the Na+ gradient established by the basolateral Na+/K+-ATPase, Na+ powers the basolateral NaK2Cl co-transporter NKCC1, raising intracellular Cl above its electrochemical equilibrium. Hence Cl can exit the cell passively through apical, cAMP-stimulated CFTR Cl channels, resulting in Cl secretion. Basolateral K+ channels are needed to recycle K+. These channels additionally render the cell interior more negative, increasing the driving force for apical Cl exit. Colonic cells express both cAMP-activated KCNQ1/KCNE3 K+ channels and Ca2+-activated KCNN4 (SK4, KCa3.1) K+ channels. The epithelial sodium channel ENaC, which we inhibited with amiloride in our experiments, is rather expressed in surface epithelial cells (63) and therefore not included in the cell model. B and C, representative traces from Ussing chamber experiments showing short circuit currents (Isc) across WT (B) and kcne3−/− (C) distal colon clamped to 0 mV. Luminal amiloride (amil; 0 μm), serosal forskolin (FSK; 10 μm), serosal chromanol 293B (C293B; 10 μm), and serosal carbachol (CCH, 100 μm) were present as indicated by the bars. D–F, mean ΔIsc from WT and KO distal colon (D), jejunum (E), and ileum (F) under different conditions (data from six or seven WT and six KO mice; means ± S.E.; ***, p < 0.0001 (colon) and p < 0.0002 (ileum); *, p < 0.03 (unpaired t test)). The resistance of the colonic tissues was 66.8 ± 5.2 (WT) and 68.4 ± 5.0 (KO) Ωcm2, of jejunum 55.2 ± 6.6 (WT) and 56.0 ± 5.2 (KO), and of ileum 59.5 ± 3.5 (WT) and 49.7 ± 4.8 (KO) Ωcm2. The resistance of the fluid amounted to 19–25 Ωcm2.
FIGURE 7.
FIGURE 7.
Effect of secretagogues on ion transport by tracheal epithelia from WT and kcne3−/− mice measured under current-clamp conditions. A, Ussing-chamber recording of transepithelial voltage (Vte) across WT (left panel) and KO (right panel) tracheal samples. The upper border of the line shows Vte, and the length of the downward voltage deflections reflects the transepithelial resistance (Rte). Luminal application of amiloride (20 μm), and basolateral FSK (2 μm), IBMX (100 μm), and C293B (10 μm) is indicated above. B, similar recordings exploring effects of luminal ATP (100 μm). ATP caused a rapid transient increase (“peak”) of Vte in WT trachea, followed by a steady state lumen-negative Vte. Both deflections were drastically reduced in the KO. C, mean calculated short circuit current (Isc) before and after application of amiloride (10 μm) (number of measurements: WT, twelve; KO, eleven; one/animal). D, differential currents (ΔIsc) induced by 2 μm forskolin (FSK) and 100 μm IBMX (left bars) and calculated C293B-sensitive component of forskolin-stimulated current (right bars). E, maximal (peak) and steady state (plateau) differential currents ΔIsc induced by 100 μm ATP (values averaged from twelve (WT) and ten (KO) experiments (one/mouse). F and G, similar experiments in the presence of 20 μm amiloride to abolish Na+-transport. F, original recordings showing effects of luminal ATP (100 μm), FSK (2 μm) + IBMX (100 μm), and carbachol (100 μm) on WT and KO tracheas. G, mean differential currents (ΔIsc) induced by 100 μm ATP, 2 μm FSK + 100 μm IBMX, or 100 μm carbachol, always in the presence of 20 μm amiloride. Number of measurements (animals): WT, seven; KO, seven. *, p < 0.05; **, p < 0.005. The resistance values of the tracheal tissue samples were 42.2 ± 2.6 (WT; n = 12) and 46.1 ± 2.6 (KO; n = 12) Ωcm2. The resistance of the fluid in the Ussing chamber was 3.4 ± 2.1 Ωcm2.

Similar articles

Cited by

References

    1. Scott V. E., Rettig J., Parcej D. N., Keen J. N., Findlay J. B., Pongs O., Dolly J. O. (1994) Proc. Natl. Acad. Sci. U.S.A. 91, 1637–1641 - PMC - PubMed
    1. Takumi T., Ohkubo H., Nakanishi S. (1988) Science 242, 1042–1045 - PubMed
    1. Aguilar-Bryan L., Nichols C. G., Wechsler S. W., Clement J. P., Boyd A. E., 3rd, González G., Herrera-Sosa H., Nguy K., Bryan J., Nelson D. A. (1995) Science 268, 423–426 - PubMed
    1. Sanguinetti M. C. (2000) Trends Pharmacol. Sci. 21, 199–201 - PubMed
    1. McCrossan Z. A., Abbott G. W. (2004) Neuropharmacology 47, 787–821 - PubMed

Publication types

MeSH terms

LinkOut - more resources