

Trends in incidence of childhood cancer in Australia, 1983-2006
- PMID: 20051948
- PMCID: PMC2822940
- DOI: 10.1038/sj.bjc.6605503
Trends in incidence of childhood cancer in Australia, 1983-2006
Abstract
Background: There are few population-based childhood cancer registries in the world containing stage and treatment data.
Methods: Data from the population-based Australian Paediatric Cancer Registry were used to calculate incidence rates during the most recent 10-year period (1997-2006) and trends in incidence between 1983 and 2006 for the 12 major diagnostic groups of the International Classification of Childhood Cancer.
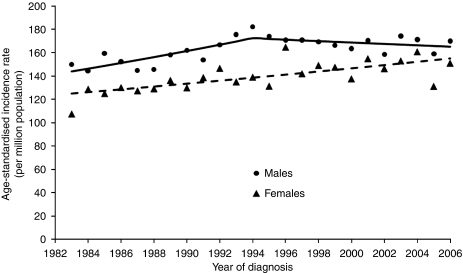
Results: In the period 1997-2006, there were 6184 childhood cancer (at 0-14 years) cases in Australia (157 cases per million children). The commonest cancers were leukaemia (34%), that of the central nervous system (23%) and lymphomas (10%), with incidence the highest at 0-4 years (223 cases per million). Trend analyses showed that incidence among boys for all cancers combined increased by 1.6% per year from 1983 to 1994 but have remained stable since. Incidence rates for girls consistently increased by 0.9% per year. Since 1983, there have been significant increases among boys and girls for leukaemia, and hepatic and germ-cell tumours, whereas for boys, incidence of neuroblastomas and malignant epithelial tumours has recently decreased. For all cancers and for both sexes combined, there was a consistent increase (+0.7% per year, 1983-2006) at age 0-4 years, a slight non-significant increase at 5-9 years, and at 10-14 years, an initial increase (2.7% per year, 1983-1996) followed by a slight non-significant decrease.
Conclusion: Although there is some evidence of a recent plateau in cancer incidence rates in Australia for boys and older children, interpretation is difficult without a better understanding of what underlies the changes reported.
Figures
References
-
- Australian Bureau of Statistics (2007) Australia's babies. In Australian Social Trends 2007. Australian Bureau of Statistics (ABS Catalogue number 4102.0). Canberra: Australia
-
- Ahmad O, Boschi-Pinto C, Lopez A, Murray C, Lozano R, Inoue M (2001) Age Standardization of Rates: a New WHO Standard. World Health Organization: Geneva
-
- AIHW (2009) ACIM (Australian Cancer Incidence and Mortality) books. (http://www.aihw.gov.au/cancer/data/acim_books/index.cfm Accessed 2 July 2009): Australian Institute of Health and Welfare
-
- Australian Institute of Health and Welfare (2009) A Picture of Australia's Children 2009 Cat. no. PHE 112 AIHW: Canberra
-
- Aziz NM, Oeffinger KC, Brooks S, Turoff AJ (2006) Comprehensive long-term follow-up programs for pediatric cancer survivors. Cancer 107: 841–848 - PubMed
Publication types
MeSH terms
LinkOut - more resources
Full Text Sources
