. 2010 Feb 2;102(3):561-9.
doi: 10.1038/sj.bjc.6605491. Epub 2010 Jan 5.

Circulating tumour cells demonstrate an altered response to hypoxia and an aggressive phenotype

Affiliations

Circulating tumour cells demonstrate an altered response to hypoxia and an aggressive phenotype

K Ameri et al. Br J Cancer. .

Abstract

Background: Tumours contain hypoxic regions that select for an aggressive cell phenotype; tumour hypoxia induces metastasis-associated genes. Treatment refractory patients with metastatic cancer show increased numbers of circulating tumour cells (CTCs), which are also associated with disease progression. The aim of this study was to examine the as yet unknown relationship between hypoxia and CTCs.

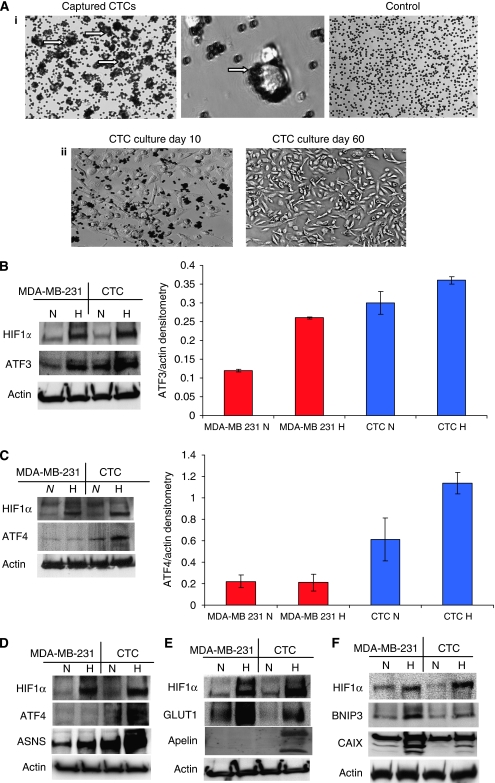
Methods: We generated human MDA-MB-231 orthotopic xenografts and, using a new technology, isolated viable human CTCs from murine blood. The CTCs and parental MDA-MB-231 cells were incubated at 21 and 0.2% (hypoxia) oxygen, respectively. Colony formation was assayed and levels of hypoxia- and anoxia-inducible factors were measured. Xenografts generated from CTCs and parental cells were compared.

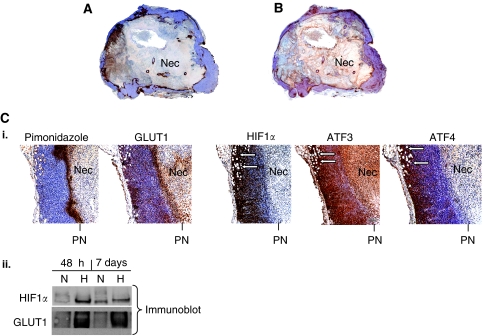
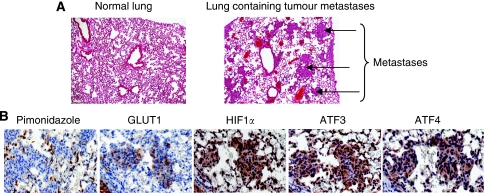
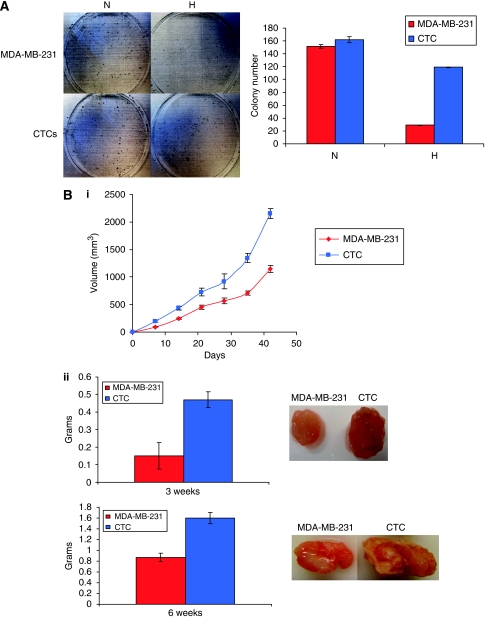
Results: MDA-MB-231 xenografts used to generate CTCs were hypoxic, expressing hypoxia factors: hypoxia-inducible factor1 alpha (HIF1alpha) and glucose transporter protein type 1 (GLUT1), and anoxia-induced factors: activating transcription factor 3 and 4 (ATF3 and ATF4). Parental MDA-MB-231 cells induced ATF3 in hypoxia, whereas CTCs expressed it constitutively. Asparagine synthetase (ASNS) expression was also higher in CTCs. Hypoxia induced ATF4 and the HIF1alpha target gene apelin in CTCs, but not in parental cells. Hypoxia induced lower levels of carbonic anhydrase IX (CAIX), GLUT1 and BCL2/adenovirus E1B 19-KD protein-interacting protein 3 (BNIP3) proteins in CTCs than in parental cells, supporting an altered hypoxia response. In chronic hypoxia, CTCs demonstrated greater colony formation than parental cells. Xenografts generated from CTCs were larger and heavier, and metastasised faster than MDA-MB-231 xenografts.

Conclusion: CTCs show an altered hypoxia response and an enhanced aggressive phenotype in vitro and in vivo.


Figures

Figure 1
Figure 1
Human breast cancer MDA-MB-231cells grown in mammary fat pad of NOD/SCID (Non-obese diabetic–severe combined immunodeficiency) mice display hypoxic/anoxic regions and express hypoxia and anoxia factors. (A) Tumour sections stained for pimonidazole and (B) the intrinsic marker GLUT1 ( × 10 magnification). (Ci) HIF1α, ATF3, and ATF4 expression in tumours and at the leading edge at sites of local invasion into surrounding normal tissues (white arrows, × 100 magnification). (Cii) Expression of HIF1α and GLUT1 in MDA-MB-231 cells after 7 days of chronic hypoxia in vitro. N, normoxia; H, hypoxia; Nec, necrotic region; PN, perinecrotic region.
Figure 2
Figure 2
MDA-MB-231 tumours result in pulmonary metastases, which express the hypoxia factors HIF1α and GLUT1, as well as the anoxia factors ATF3 and ATF4. (A) Lungs of xenograft-bearing mice demonstrated metastatic foci, as indicated by the solid arrows on haematoxylin & eosin (H&E) slides. Lungs from control mice did not contain any tumours ( × 100 magnification). (B) Expression of HIF1α, GLUT1, ATF3, and ATF4 in tumour cells in pulmonary metastatic foci.
Figure 3
Figure 3
Circulating tumour cells (CTCs), isolated and cultured from murine blood, demonstrate a distinct response to hypoxia compared with parental MDA-MB-231cells. (Ai) Freshly captured CTCs are cells with attached magnetic beads as indicated by white arrows. The magnetic beads are individual small dark circles, as can be seen in the control; CTCs covered with magnetic beads appear as dark clusters of beads on the cell membrane with translucent centres, as indicated by white arrows; lack of CTCs in blood samples obtained from six control mice without xenografts. (Aii) The magnetically captured CTCs in culture on day 10 after capture and after day 60. (BF) Induction of HIF1α in hypoxic MDA-MB-231 cells and CTCs. (B) Expression of the anoxia factor ATF3 in CTCs and MDA-MB-231 cells. Graphs demonstrate densitometry measurement of ATF3 expression normalised to actin expression from three experiments. (C) Induction of the anoxia-induced factor ATF4 in CTCs compared with MDA-MB-231 cells. Graphs demonstrate densitometry measurements of ATF4 expression normalised to actin expression from three experiments. (D) Expression of ATF4 and its target gene ASNS in CTCs, compared with parental MDA-MB-231 cells. (E and F) Differences between CTCs and parental MDA-MB-231 cells with respect to induction of HIF1α target genes. (E) Induction of apelin in hypoxic CTCs compared with parental MDA-MB-231. Hypoxic induction of (E) GLUT1 and (F) CAIX, BNIP3 in CTCs, compared with parental MDA-MB-231 cells. Experiments were performed at least three or four times with three or four different extracts. N, normoxia; H, hypoxia.
Figure 4
Figure 4
Circulating tumour cells (CTCs) demonstrate greater colony formation capabilities in chronic hypoxia compared with parental MDA-MB-231 cells and grow larger and heavier tumours. (A) Colonies grown from CTCs incubated in normoxia and chronic hypoxia compared with colonies grown from parental MDA-MB-231 cells after 10 days (graph shows mean numbers±s.e.). (Bi) Comparing sizes of xenogafts generated from CTCs with xenografts generated from MDA-MB-231 cells within 3–6 weeks of growth (graph represents mean volume±s.e., n=5); (Bii) comparing size and weight of xenografts from CTCs with xenografts from MDA-MB-231 cells at 3 and 6 weeks (graphs represent mean weight±s.e.). N, normoxia; H, hypoxia.

References

    1. Airley RE, Loncaster J, Raleigh JA, Harris AL, Davidson SE, Hunter RD, West CM, Stratford IJ (2003) GLUT-1 and CAIX as intrinsic markers of hypoxia in carcinoma of the cervix: relationship to pimonidazole binding. Int J Cancer 104: 85–91 - PubMed
    1. Ameri K, Hammond EM, Culmsee C, Raida M, Katschinski DM, Wenger RH, Wagner E, Davis RJ, Hai T, Denko N, Harris AL (2007) Induction of activating transcription factor 3 by anoxia is independent of p53 and the hypoxic HIF signalling pathway. Oncogene 26: 284–289 - PubMed
    1. Ameri K, Harris AL (2008) Activating transcription factor 4. Int J Biochem Cell Biol 40: 14–21 - PubMed
    1. Ameri K, Lewis CE, Raida M, Sowter H, Hai T, Harris AL (2004) Anoxic induction of ATF-4 through HIF-1-independent pathways of protein stabilization in human cancer cells. Blood 103: 1876–1882 - PubMed
    1. Blais JD, Filipenko V, Bi M, Harding HP, Ron D, Koumenis C, Wouters BG, Bell JC (2004) Activating transcription factor 4 is translationally regulated by hypoxic stress. Mol Cell Biol 24: 7469–7482 - PMC - PubMed

Publication types

Substances