. 2010 Jun;30(6):1121-36.
doi: 10.1038/jcbfm.2009.277. Epub 2010 Jan 6.

Ascorbic acid prevents blood-brain barrier disruption and sensory deficit caused by sustained compression of primary somatosensory cortex

Affiliations

Ascorbic acid prevents blood-brain barrier disruption and sensory deficit caused by sustained compression of primary somatosensory cortex

Jia-Li Lin et al. J Cereb Blood Flow Metab. 2010 Jun.

Abstract

Transient compression of rat somatosensory cortex has been reported to affect cerebral microvasculature and sensory function simultaneously. However, the effects of long-term cortical compression remain unknown. Here, we investigated whether and to what extent sustained but moderate epidural compression of rat somatosensory cortex impairs somatic sensation and/or cortical microvasculature. Electrophysiological and behavioral tests revealed that sustained compression caused only short-term sensory deficit, particularly at 1 day after injury. Although the diameter of cortical microvessels was coincidentally reduced, no ischemic insult was observed. By measuring Evans Blue and immunoglobulin G extravasation, the blood-brain barrier (BBB) permeability was found to dramatically increase during 1 to 3 days, but this did not lead to brain edema. Furthermore, immunoblotting showed that the BBB component proteins occludin, claudin-5, type IV collagen, and glial fibrillary acidic protein were markedly upregulated in the injured cortex during 1 to 2 weeks when BBB regained integrity. Conversely, treatment of ascorbic acid prevented compression-induced BBB disruption and sensory impairment. Together, these data suggest that sustained compression of the somatosensory cortex compromises BBB integrity and somatic sensation only in the early period. Ascorbic acid may be used therapeutically to modulate cortical compression and/or BBB dysfunction.


Figures

Figure 1
Figure 1
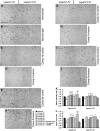
Photomicrographs from coronal sections of the primary somatosensory cortices processed with cytochrome oxidase reaction, 3-nitrotyrosine (3-NT), or 4-hydroxynonenal (4-HNE) immunolabeling. (A and B) Show the contralateral (left) and compressed (right) sides, respectively, of the same section from one representative rat at 1 day after surgery. The staining technique revealed the barrels (black arrowheads) in layer IV of the somatosensory cortex, which is the topographic area of the contralateral whiskers. Layer IV, contiguous to the barrel field, represents the forelimb and hindlimb area (white arrowheads), which did not form barrels but is still evident. Physical compression caused a concave (arrows in B) on the somatosensory cortex and decreased the cortical thickness (compare A with B). (CJ) Show the immunoreactivities of 3-NT (CF) and 4-HNE (GJ) in the right somatosensory cortex of a representative normal rat (C and G) and rats that received cortical compressin (D and H), cortical compression and ascorbic acid injection (E and I), or cortical compression and apocynin injection (F and J), and survived for 1 day after surgery. Compared with the normal rat (C and G), immunoreactivities of 3-NT and 4-HNE in stellate cells (black arrowheads) and microvessel walls (white arrowheads) were apparently increased after compression (D and H). (K) Shows the mean OD ratios of 3-NT and 4-HNE immunoreactivity in the total somatosensory cortical areas. Mean±s.e.m., n=4 per group, d=day. **P<0.01, ***P<0.001, compared with the normal group; ###P<0.001, compared with the animal group surviving for 1 day after compression (Comp-1d). Scale bar=300 μm (A and B) or 25 μm (CJ).
Figure 2
Figure 2
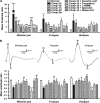
Time-dependent changes in the mean threshold ratios of the von Frey behavioral test (A) and the mean amplitude ratios of the somatosensory evoked potentials (SSEPs) (B) from normal animals and animals subjected to compression of the right somatosensory cortices. The upper panels in B were example SSEP waveforms recorded from a normal animal. The N1-P1 component was used to analyze the peak-to-peak amplitude. Mean±s.e.m., n=4 per group, d=day, w=week, m=month. *P<0.05, **P<0.01, ***P<0.001, compared with each corresponding normal; #P<0.05, ##P<0.01, ###P<0.001, compared with each corresponding animal group surviving for 1 day after compression (Comp-1d).
Figure 3
Figure 3
The cortical microvasculature, revealed by alkaline phosphatase histochemistry, in the coronal sections of the normal and the compressed somatosensory cortices. Micrographs were taken from the left (contralateral) and the right (lesion) sides of the same sections of representative normal rats (A and B) and rats surviving for 1 day (C and D), 3 days (E and F), 1 week (G and H), and 2 weeks (I and J) after surgery. The vertical lines on the top of the figure depict the boundaries between cortical layers IV and V in all panels. (K and L) Show the time-dependent changes in the mean diameter ratios and the mean area ratios of cortical microvessels. Mean±s.e.m., n=4 per group, d=day, w=week, m=month. *P<0.05, compared with each corresponding normal; #P<0.05, ##P<0.01, ###P<0.001, compared with each corresponding animal group surviving for 1 day after compression (Comp-1d). Scale bar=300 μm.
Figure 4
Figure 4
Effects of sustained cortical compression on the 2,3,5-triphenyltetrazolium chloride staining and the Evans Blue extravasation. (A) Shows a representative 2,3,5-triphenyltetrazolium chloride-stained coronal slice from a normal rat. (B) Shows a 2,3,5-triphenyltetrazolium chloride-stained slice from a rat that received a permanent ligation of only a branch of the middle cerebral artery (to reduce the suffering of the rat) and survived for 1 day after surgery. Note that the ischemic sign (loss of red stain) was detected in this slice (arrowhead). (C and D) Show representative 2,3,5-triphenyltetrazolium chloride-stained slices from the rats surviving for 1 day and 3 days after compression. (EO) Are representative whole brains from different animal groups receiving Evans Blue perfusion. In the normal animal (E), no Evans Blue was seen in the tissue except in the pineal gland (arrowhead). (P) Shows the time-dependent changes in the mean OD ratios of extravasated Evans Blue. Mean±s.e.m., n=4 per group, d=day, w=week, m=month. **P<0.01, compared with the normal animal group; #P<0.05, ##P<0.01, compared with the animal group surviving for 3 days after compression (Comp-3d). Scale bars=3 mm (AD) and 10 mm (EO).
Figure 5
Figure 5
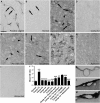
Endogenous IgG extravasation after cortical compression. (A) Shows a representative image of the somatosensory cortex from a normal rat. The rat was not perfused with saline, which can clear the content of vasculature and thus the serum IgG remains in the microvessels (arrows). (B) In contrast, a normal rat received saline perfusion, and therefore the IgG immunostaining is negative in the microvessels (arrows). (C) Cortical compression led to drastic IgG leakage into the brain parenchyma at 1 day after surgery. The immunoreactivity was also present within the cytoplasm of layer IV neurons (arrowheads) and some of them were intensely stained (arrows). (D) At 3 days after compression, the IgG immunoreactivity was abruptly decreased in the brain parynchyma. (E, F, H, and I) Treatment of ascorbic acid, α-tocopherol, apocynin, or allopurinol markedly blocked the IgG leakage at 1 day after compression, although some neurons were still immunostained (arrowheads in E and arrows in F). (G) In contrast, treatment of -NAME caused the extravasated IgG to concentrate on the cortical neurons. (J) Shows the time-dependent changes in the mean OD ratios of IgG immunoreactivity in the total somatosensory cortical areas. Mean±s.e.m., n=4 per group, d=day, w=week, m=month. ***P<0.001, compared with the normal group; ##P<0.01, ###P<0.001, compared with the animal group surviving for 1 day after compression (Comp-1d). (KM) Show the IgG immunoreactivity in the pial vessels dorsal to the somatosensory cortices of a normal rat (K), a rat surviving for 1 day after compression (L), and a rat that received cortical compression and allopurinol injection and survived for 1 day after compression (M). Scale bar=25 μm (AI) or 50 μm (KM).
Figure 6
Figure 6
Analyses of the brain water content and the expressions of the BBB components after cortical compression. (A) To exclude the aging factor, each group of compressed (Comp) animals (n=4) was accompanied by a group of normal animals (n=2). The brain water content in both the left and right cerebral hemispheres of all normal rats was maintained within 78% to 80%, although a slight decrease was seen in the older rats that had survived for 3 months (Normal-3m). Sustained compression of the somatosensory cortex did not elicit significant alteration of the percentage at all time points, relative to each corresponding normal. (B and C) Representative Western blots and summary data from the normal and the compressed somatosensory cortices. β-Actin served as the internal control. Mean±s.e.m., n=4 per group, d=day, w=week, m=month. *P<0.05, **P<0.01, ***P<0.001, compared with each corresponding normal.
Figure 7
Figure 7
Astrocytic reaction and coverage on the microvasculature after cortical compression. (AD) Are representative immunofluorescent micrographs showing the astrocytic reaction in layer IV (A and B) and layer V (C and D) of the somatosensory cortices. In contrast to the contralateral cortex (A and C), astrocytic reaction was markedly upregulated in the compressed cortex at 1 week after surgery (B and D). (EH) Are representative micrographs double-labeled with the GFAP immunohistochemistry to reveal astrocytes and the alkaline phosphatase histochemistry to reveal cortical microvessels. In contrast to the normal rats (E), astrocytic coverage on the cortical microvessels was abruptly increased at 1 day after compression, regardless of the size of the blood vessels (FH). The tiny microvessels with a diameter less than 5 μm (arrowheads in E and G) were difficult to analyze and not included in the quantification. (I) Shows the time-dependent changes in the mean astrocytic coverage ratios. Mean±s.e.m., n=4 per group, d=day, w=week, m=month. *P<0.05, compared with each corresponding normal; #P<0.05, compared with each corresponding animal group surviving for 1 day after compression (Comp-1d). Scale bar=25 μm.

Similar articles

Cited by

References

    1. Abbott NJ, Ronnback L, Hansson E. Astrocyte-endothelial interactions at the blood-brain barrier. Nat Rev Neurosci. 2006;7:41–53. - PubMed
    1. Andras IE, Deli MA, Veszelka S, Hayashi K, Hennig B, Toborek M. The NMDA and AMPA/KA receptors are involved in glutamate-induced alterations of occludin expression and phosphorylation in brain endothelial cells. J Cereb Blood Flow Metab. 2007;27:1431–1443. - PubMed
    1. Boje KM, Lakhman SS. Nitric oxide redox species exert differential permeability effects on the blood-brain barrier. J Pharmacol Exp Ther. 2000;293:545–550. - PubMed
    1. Burnett MG, Detre JA, Greenberg JH. Activation-flow coupling during graded cerebral ischemia. Brain Res. 2005;1047:112–118. - PubMed
    1. Chen JR, Wang YJ, Tseng GF. The effect of epidural compression on cerebral cortex: a rat model. J Neurotrauma. 2003;20:767–780. - PubMed

Publication types

MeSH terms