Acute-stage diffusion-weighted magnetic resonance imaging for predicting outcome of poor-grade aneurysmal subarachnoid hemorrhage
- PMID: 20051974
- PMCID: PMC2949205
- DOI: 10.1038/jcbfm.2009.264
Acute-stage diffusion-weighted magnetic resonance imaging for predicting outcome of poor-grade aneurysmal subarachnoid hemorrhage
Abstract
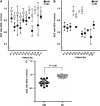
We investigated the role of acute-stage diffusion-weighted images (DWIs) for predicting outcome of poor-grade subarachnoid hemorrhage (SAH). This study included 38 patients with poor-grade SAH who underwent DWI within 24 h after onset. DWI findings were divided into three groups on the basis of lesion area: none (N), spotty (S, <or=10 mm(2)), or areal (A, >10 mm(2)). We evaluated the correlation between preoperative DWI findings and clinical outcome, and the characteristics of DWI abnormalities. DWI abnormalities were revealed in 81.6% of cases (group S 34.2%; group A 47.3%). All patients in groups N and S and 73.3% of patients in group A were treated radically. For those patients without rerupture, favorable outcomes were achieved in 100% of group N, 53.8% of group S, and 0% of group A. Abnormal lesions on initial DWI, which resulted in permanent lesions, showed a mean apparent diffusion coefficient ratio to the control value of 0.71, which was significantly lower than 0.95 observed in reversible lesions (P<0.01). We recommend radical treatment for even poor-grade SAH as long as the preoperative DWI shows no or only spotty lesions. DWI may provide an objective means to estimate the outcome of poor-grade SAH.
Figures


Similar articles
-
Acute ischemic injury on diffusion-weighted magnetic resonance imaging after poor grade subarachnoid hemorrhage.Neurocrit Care. 2011 Jun;14(3):407-15. doi: 10.1007/s12028-010-9488-1. Neurocrit Care. 2011. PMID: 21174171
-
Ischemic Lesions in Acute and Subacute Perimesencephalic Subarachnoid Hemorrhage.AJR Am J Roentgenol. 2019 Feb;212(2):418-424. doi: 10.2214/AJR.18.19700. Epub 2018 Dec 17. AJR Am J Roentgenol. 2019. PMID: 30557051
-
A Comparison of Diffusion-Weighted Imaging Abnormalities Following Balloon Remodeling for Aneurysm Coil Embolization in the Ruptured vs Unruptured Setting.Neurosurgery. 2018 Apr 1;82(4):516-524. doi: 10.1093/neuros/nyx240. Neurosurgery. 2018. PMID: 28520916
-
Hyperacute cerebral aneurysm rerupture during CT angiography.J Neurosurg. 2012 Jun;116(6):1244-50. doi: 10.3171/2012.2.JNS111175. Epub 2012 Mar 23. J Neurosurg. 2012. PMID: 22443505 Review.
-
Comprehensive review of imaging of intracranial aneurysms and angiographically negative subarachnoid hemorrhage.Neurosurg Focus. 2019 Dec 1;47(6):E20. doi: 10.3171/2019.9.FOCUS19653. Neurosurg Focus. 2019. PMID: 31786554 Review.
Cited by
-
Early brain injury and cognitive impairment after aneurysmal subarachnoid haemorrhage.Sci Rep. 2021 Dec 1;11(1):23245. doi: 10.1038/s41598-021-02539-x. Sci Rep. 2021. PMID: 34853362 Free PMC article.
-
Outcome in poor grade subarachnoid hemorrhage patients treated with acute endovascular coiling of aneurysms and aggressive intensive care.Neurocrit Care. 2011 Jun;14(3):341-7. doi: 10.1007/s12028-010-9377-7. Neurocrit Care. 2011. PMID: 20464529
-
Altered Resting-State Connectivity within Executive Networks after Aneurysmal Subarachnoid Hemorrhage.PLoS One. 2015 Jul 14;10(7):e0130483. doi: 10.1371/journal.pone.0130483. eCollection 2015. PLoS One. 2015. PMID: 26172281 Free PMC article.
-
The impact of residual hematoma after evacuation on the outcomes of patients with ruptured intracranial aneurysms with intracerebral hematoma: A longitudinal single-center observational study.Medicine (Baltimore). 2022 Sep 9;101(36):e30129. doi: 10.1097/MD.0000000000030129. Medicine (Baltimore). 2022. PMID: 36086761 Free PMC article.
-
The Role of Platelet Activation and Inflammation in Early Brain Injury Following Subarachnoid Hemorrhage.Neurocrit Care. 2017 Feb;26(1):48-57. doi: 10.1007/s12028-016-0292-4. Neurocrit Care. 2017. PMID: 27430874 Free PMC article.
References
-
- Alvord EC, Jr, Loeser JD, Bailey WL, Copass MK. Subarachnoid hemorrhage due to ruptured aneurysms: A simple method of estimating prognosis. Arch Neurol. 1972;27:273–284. - PubMed
-
- Bailes JE, Spetzler RF, Hadley MN, Baldwin HZ. Management morbidity and mortality of poor-grade aneurysm patients. J Neurosurg. 1990;72:559–566. - PubMed
-
- Bonita R, Thomson S. Subarachnoid hemorrhage: Epidemiology, diagnosis, management, and outcome. Stroke. 1985;16:591–594. - PubMed
-
- Busch E, Beaulieu C, de Crespigny A, Moseley ME, Paul J. Diffusion MR imaging during acute subarachnoid hemorrhage in rats. Stroke. 1998;29:2155–2161. - PubMed
-
- Drake CG.1998Report of World Federation of Neurological Surgeons Committee on a universal subarachnoid hemorrhage grading scale J Neurosurg 68985–986.(letter) - PubMed
Publication types
MeSH terms
LinkOut - more resources
Full Text Sources
Medical

