. 2009 Dec 21;17(26):23352-73.
doi: 10.1364/OE.17.023352.

Quantitative study of single molecule location estimation techniques

Affiliations

Quantitative study of single molecule location estimation techniques

Anish V Abraham et al. Opt Express. .

Abstract

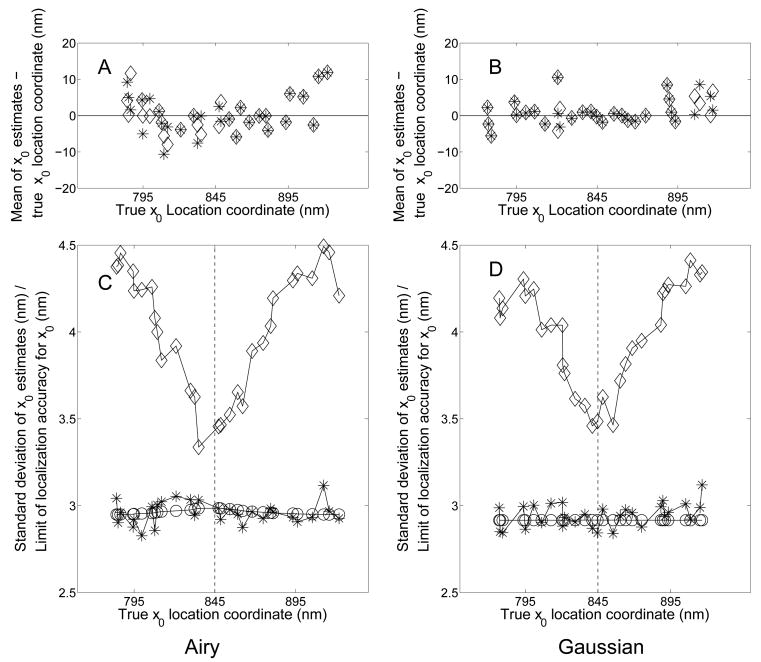
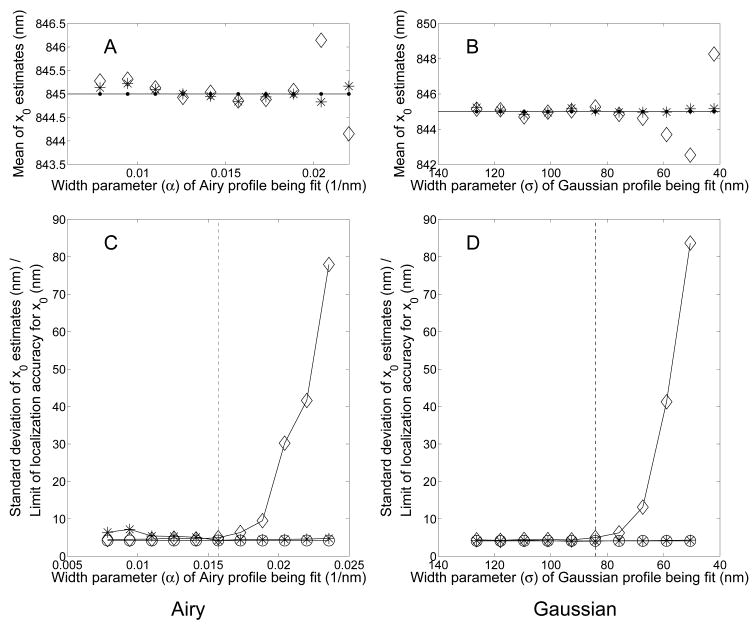
Estimating the location of single molecules from microscopy images is a key step in many quantitative single molecule data analysis techniques. Different algorithms have been advocated for the fitting of single molecule data, particularly the nonlinear least squares and maximum likelihood estimators. Comparisons were carried out to assess the performance of these two algorithms in different scenarios. Our results show that both estimators, on average, are able to recover the true location of the single molecule in all scenarios we examined. However, in the absence of modeling inaccuracies and low noise levels, the maximum likelihood estimator is more accurate than the nonlinear least squares estimator, as measured by the standard deviations of its estimates, and attains the best possible accuracy achievable for the sets of imaging and experimental conditions that were tested. Although neither algorithm is consistently superior to the other in the presence of modeling inaccuracies or misspecifications, the maximum likelihood algorithm emerges as a robust estimator producing results with consistent accuracy across various model mismatches and misspecifications. At high noise levels, relative to the signal from the point source, neither algorithm has a clear accuracy advantage over the other. Comparisons were also carried out for two localization accuracy measures derived previously. Software packages with user-friendly graphical interfaces developed for single molecule location estimation (EstimationTool) and limit of the localization accuracy calculations (FandPLimitTool) are also discussed.


Figures

Fig. 1
Fig. 1
Comparison of standard deviation of estimates from the nonlinear least squares and maximum likelihood estimators in the ideal case. Panels A(B) and C(D) show the results when the Airy (Gaussian) pixelated profile was used both to generate and fit the single molecule images. Panels A(C) and B(D) show the mean (standard deviations) of the x0 coordinate estimates from the nonlinear least squares (◊) and maximum likelihood (*) estimators. (●) indicates the true x0 coordinate value and (○) the PLAM or limit of the localization accuracy of x0. For each value of the expected number of photons at the detector plane, 1000 images of a stationary single molecule were generated. Location coordinates (x0,y0) were estimated from each image using both estimators. Values for the width, photon detection rate, and background parameters, were fixed to the values used to generate the images. The following numerical values were used when simulating the single molecule images. Pixel size: 13 μm × 13 μm, pixel array size: 13 × 13, magnification M = 100. The single molecule image was centered within the pixel array. The mean of the background noise component was set to zero. When the Airy pixelated profile was used to generate the single molecule images or to fit them, wavelength λ = 520 nm, and numerical aperture na = 1.3. When the Gaussian pixelated profile was used to generate the single molecule images or to fit them, the width parameter of the Gaussian pixelated profile was calculated as σ = 1.323λ/2πna = 84.225 nm.
Fig. 2
Fig. 2
Comparison of standard deviation of estimates from the nonlinear least squares and maximum likelihood estimators in the presence of additive Poisson noise and absence of model mismatches or misspecifications. Panels A(B) and C(D) show the results when the Airy(Gaussian) pixelated profile was used both to generate and fit the single molecule images. Panels A(C) and B(D) show the mean (standard deviations) of the x0 coordinate estimates from the nonlinear least squares (◊) and maximum likelihood (*) estimators. (●) indicates the true x0 coordinate value and (○) the PLAM or limit of the localization accuracy of x0. For each value of the total background photon count, 1000 images of a stationary single molecule were generated. Location coordinates (x0,y0) were estimated from each image using both estimators. Values for the width, photon detection rate, and background parameters, were fixed to the values used to generate the images. The following numerical values were used when simulating the single molecule images. Pixel size: 13 μm × 13 μm, pixel array size: 13 × 13, magnification M = 100. The single molecule image was centered within the pixel array. When the Airy pixelated profile was used to generate the single molecule images or to fit them, wavelength λ = 520 nm, and numerical aperture na = 1.3. When the Gaussian pixelated profile was used to generate the single molecule images or to fit them, the width parameter of the Gaussian pixelated profile was calculated as σ = 1.323λ/2πna = 84.225 nm.
Fig. 3
Fig. 3
Comparison of standard deviation of estimates from the nonlinear least squares and maximum likelihood estimators in the presence of extraneous Poisson and Gaussian noise sources and the absence of model mismatches. Panels A(C) and B(D) shows the mean(standard deviations) of the x0 coordinate estimates from the nonlinear least squares (◊) and maximum likelihood (*) estimators. (●) indicates the true x0 coordinate value, and (○) the PLAM or limit of the localization accuracy of x0. In panels A and C, 1000 images of a stationary single molecule were generated using the Airy pixelated profile and readout noise with standard deviation of 4e for each value of the total background photon count. In panels B and D, 1000 images of a stationary single molecule were generated using the Airy pixelated profile and fixed background of 2 photons/pixel/s for each value of the standard deviation of Gaussian noise. The mean of the Gaussian noise component was set to zero in all cases. Location coordinates (x0,y0) were estimated from each image using both estimators. Values for the width, photon detection rate, and background parameters, were fixed to the values used to generate the images. The following numerical values were used when simulating the single molecule images. Pixel size: 13 μm × 13 μm, pixel array size: 13 × 13, expected number of photons from the single molecule at the detector plane: 1000 photons, magnification M = 100, wavelength λ = 520 nm, numerical aperture na = 1.3. The single molecule image was centered within the pixel array.
Fig. 4
Fig. 4
Comparison of standard deviation of estimates from the nonlinear least squares and maximum likelihood estimators when the point source is away from the center of the image array. Panels A and B show the difference between the mean of the x0 coordinate estimates from both algorithms and the true x0 coordinate value. Panels C and D show the standard deviations of the x0 coordinate estimates from both estimators. (◊) show the results from the nonlinear least squares estimator, (*) the results from the maximum likelihood estimator, and (○) the PLAM or limit of the localization accuracy of x0. The dashed line indicates the center of the image array in absolute coordinates. For each position of the point source. 1000 images of a stationary single molecule were generated using either the Airy (panels A and C) or Gaussian (panels B and D) pixelated profile. Location coordinates (x0,y0) were estimated from each image using both estimators. Values for the width, photon detection rate, and background parameters, were fixed to the values used to generate the images. The following numerical values were used when simulating the single molecule images. Pixel size: 13 μm × 13 μm, pixel array size: 13 × 13, expected number of photons from the single molecule at the detector plane: 1000 photons, magnification M = 100. When the Airy pixelated profile was used to generate the single molecule images or to fit them, wavelength λ = 520 nm, and numerical aperture na = 1.3. When the Gaussian pixelated profile was used to generate the single molecule images or to fit them, the width parameter of the Gaussian pixelated profile was calculated as σ = 1.323λ/2πna = 84.225 nm. The x0 coordinate of the center of the pixel array in the object space is 845nm.
Fig. 5
Fig. 5
Comparison of the accuracies of the nonlinear least squares and maximum likelihood estimators when the data is generated and fit with the same type of profile but the width parameter is misspecified. Panels A(B) and C(D) show the results when the Airy (Gaussian) pixelated profile was used both to generate the images of the single molecule and to fit them. Panels A(C) and B(D) show the mean (standard deviations) of the x0 coordinate estimates from both the nonlinear least squares (◊) and the maximum likelihood (*) estimators. (●) indicates the true x0 coordinate value. (○) indicates the PLAM or limit of the localization accuracy of x0. The dashed line indicates the correct value for the width parameter. Values for the photon detection rate and background parameters were fixed to their true values, i.e., the values used to generate the images. In both cases, sets of 1000 images of a stationary single molecule were generated. The location coordinates (x0,y0) were estimated from each image using both algorithms. The width parameter of the profile being fit was misspecified by various amounts between sets of images. The following numerical values were used when simulating the single molecule images. Pixel size: 13 μm × 13 μm, pixel array size: 13 × 13, magnification M = 100. The single molecule image was centered within the pixel array. The mean of the background noise component was set to zero. When the Airy pixelated profile was used to generate the single molecule images, wavelength λ = 520 nm, and numerical aperture na = 1.3, resulting in α = 0.0157 nm−1. When the Gaussian pixelated profile was used to generate the single molecule images, the width parameter of the Gaussian pixelated profile was calculated as σ = 1323λ/2πna = 84.225 nm.
Fig. 6
Fig. 6
Comparison of the accuracies of the nonlinear least squares and maximum likelihood estimators when Gaussian pixelated profiles are used to fit data generated using Airy pixelated profiles. Panels A(C) and B(D) show the mean (standard deviation) of the x0 coordinate estimates from both the nonlinear least squares (◊) and the maximum likelihood (*) estimators. (●) indicates the true x 0 coordinate value. (○) indicates the PLAM or limit of the localization accuracy of x0. In panels A and C, sets of 1000 images were generated for each value of the expected photon count at the detector plane. In panels B and D, sets of 1000 images were generated with the expected photon count at the detector plane set to 500 photons. In both cases, the location coordinates (x0,y0) were estimated from each image using both the nonlinear least squares and maximum likelihood estimators. Values for the photon detection rate and background parameters were fixed to their true values, i.e., the values used to generate the images. In panels A and C the value for the width parameter was also fixed to the true value. All images were generated using Airy pixelated profiles and fit using Gaussian pixelated profiles. In panels B and D, the width parameter of the Gaussian profile was misspecified by varying amounts between sets of images. The dashed line indicates the best approximate for the Gaussian width parameter. The following numerical values were used when simulating the single molecule images. Pixel size: 13 μm × 13 μm, pixel array size: 13 × 13, magnification M = 100. The single molecule image was centered within the pixel array. The mean of the background noise component is set to zero. For the Airy pixelated profile used to generate the single molecule images, wavelength λ = 520 nm, and numerical aperture na = 1.3, resulting in α = 0.0157 nm−1. For the Gaussian pixelated profile used to fit the images (in the absence of misspecifications), the width parameter was calculated as σ = 1323λ/2πna = 84.225 nm.
Fig. 7
Fig. 7
Comparison of the FLAM and PLAM with estimates of the localization error according to Thompson et. al. [17]. The PLAM for the Airy pixelated profile (○) and estimates of the localization error given by Eq. 1 [17] (⊗) are plotted as a function of pixel size. For comparison, the FLAM (⨀) and the corresponding localization error estimate by Thompson et. al. for the ideal case (×), calculated as s/N are also plotted. For each pixel size, a set of 1000 single molecule images were generated using the Airy pixelated profile. The standard deviation, calculated independently for each pixel size, of the single molecule location coordinate estimates from each image obtained using both the nonlinear least squares (◊) and maximum likelihood (*) estimators are also shown. The numerical values used in the calculations are as follows. Pixel array size: closest match to 169μm × 169μm total detector area, magnification M = 100, expected number of photons from the single molecule: 500 photons. The single molecule image was centered within the detector area. The mean of the background noise component is set to zero. For the Airy profile, wavelength λ = 520 nm, and numerical aperture na = 1.3. For the calculations of the localization error based on Eq. 1, s is calculated as 1323λ/2πna = 84.225 nm, N = 500 (expected number of photons from the single molecule), and a is obtained by dividing the pixel size by the magnification.

References

    1. Xie XS, Choi PJ, Li GW, Lee NK, Lia G. Single-molecule approach to molecular biology in living bacterial cells. Annu Rev Biophys. 2008;37:417–444. - PubMed
    1. Moerner WE. New directions in single-molecule imaging and analysis. Proc Natl Acad Sci USA. 2007;104:12,596–12,602. - PMC - PubMed
    1. Dahan M, Levi S, Luccardini C, Rostaing P, Riveau B, Triller A. Diffusion dynamics of glycine receptors revealed by single-quantum dot tracking. Science. 2003;302:442–445. - PubMed
    1. Lommerse PHM, Blab GA, Cognet L, Harms GS, Snaar-Jagalska BE, Spaink HP, Schmidt T. Single-molecule imaging of the H-Ras membrane-anchor reveals domains in the cytoplasmic leaflet of the cell membrane. Biophys J. 2004;86:609–616. - PMC - PubMed
    1. Lommerse PHM, Snaar-Jagalska BE, Spaink HP, Schmidt T. Single-molecule diffusion measurements of H-Ras at the plasma membrane of live cells reveal microdomain localization upon activation. J Cell Sci. 2005;118:1799–1809. - PubMed

Publication types

MeSH terms