

Identification of networks of co-occurring, tumor-related DNA copy number changes using a genome-wide scoring approach
- PMID: 20052266
- PMCID: PMC2791203
- DOI: 10.1371/journal.pcbi.1000631
Identification of networks of co-occurring, tumor-related DNA copy number changes using a genome-wide scoring approach
Abstract
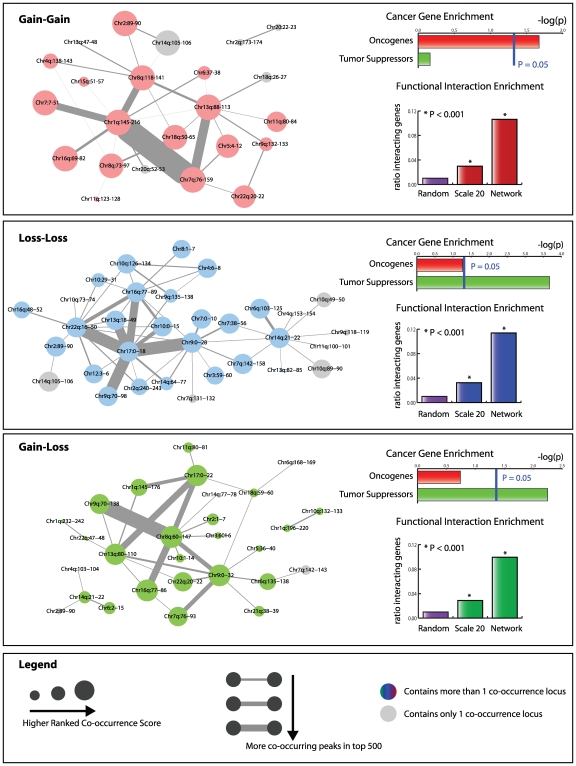
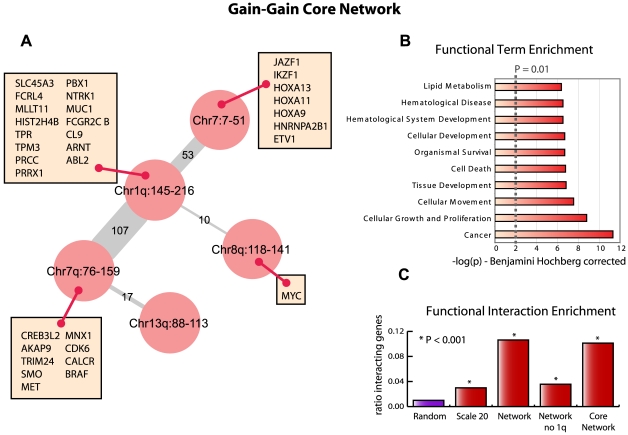
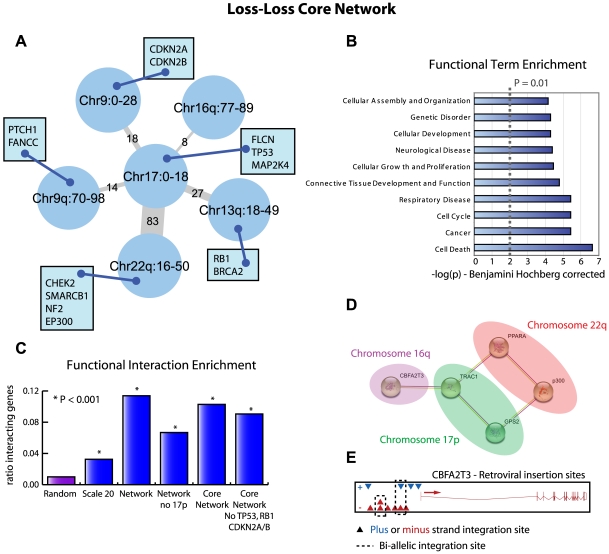
Tumorigenesis is a multi-step process in which normal cells transform into malignant tumors following the accumulation of genetic mutations that enable them to evade the growth control checkpoints that would normally suppress their growth or result in apoptosis. It is therefore important to identify those combinations of mutations that collaborate in cancer development and progression. DNA copy number alterations (CNAs) are one of the ways in which cancer genes are deregulated in tumor cells. We hypothesized that synergistic interactions between cancer genes might be identified by looking for regions of co-occurring gain and/or loss. To this end we developed a scoring framework to separate truly co-occurring aberrations from passenger mutations and dominant single signals present in the data. The resulting regions of high co-occurrence can be investigated for between-region functional interactions. Analysis of high-resolution DNA copy number data from a panel of 95 hematological tumor cell lines correctly identified co-occurring recombinations at the T-cell receptor and immunoglobulin loci in T- and B-cell malignancies, respectively, showing that we can recover truly co-occurring genomic alterations. In addition, our analysis revealed networks of co-occurring genomic losses and gains that are enriched for cancer genes. These networks are also highly enriched for functional relationships between genes. We further examine sub-networks of these networks, core networks, which contain many known cancer genes. The core network for co-occurring DNA losses we find seems to be independent of the canonical cancer genes within the network. Our findings suggest that large-scale, low-intensity copy number alterations may be an important feature of cancer development or maintenance by affecting gene dosage of a large interconnected network of functionally related genes.
Conflict of interest statement
The authors have declared that no competing interests exist.
Figures
 and
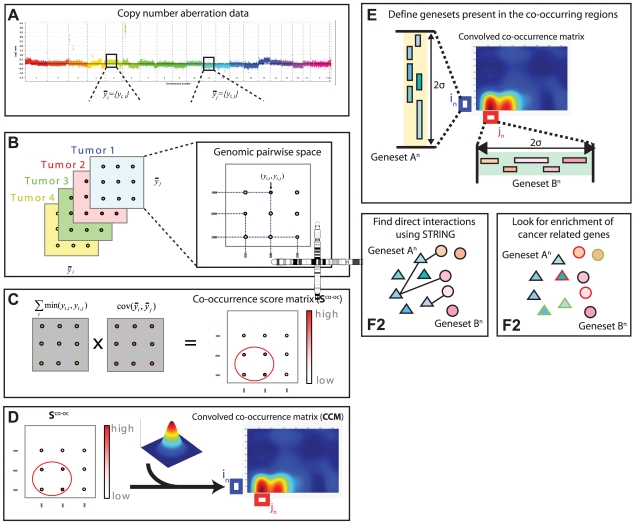
and  are vectors of genomic grid points spanning a chromosome arm (see Materials and Methods). The genomic grid is constructed from aCGH probe measurements, as explained in the Materials and Methods section. b. The combinations of
  and
and  are used to construct a genomic pair-wise space in which all further calculations are performed. In this panel a schematic view of the genomic pair-wise space is shown. Each pair of genomic grid points between
  and
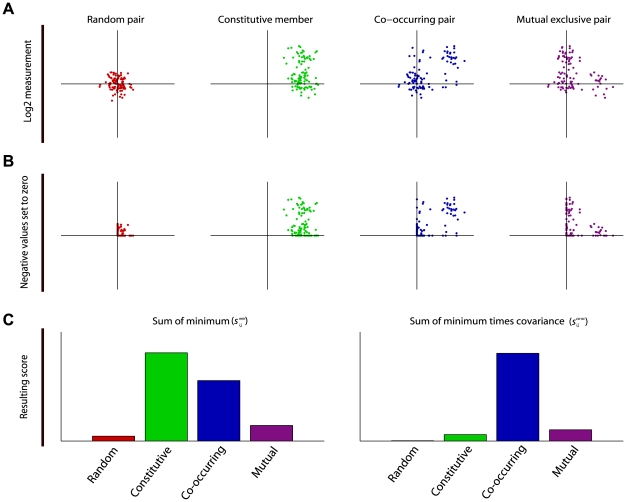
and  is a point in this space and each point contains two values. A pair-wise genomic matrix exists for each tumor in the data set. c. To score for co-occurrence, the minimum value of the pairs of genomic grid points are summed over the tumors and the co-variance over tumors of all genomic grid points is calculated. This results in two equally sized matrices which are multiplied element wise to produce the co-occurrence score matrix. This matrix is again represented in the genomic pair-wise space (
 ). d. The co-occurrence score matrix is convolved with a Gaussian matrix to find local enrichment of high co-occurrence scores in the pair-wise space. Peaks in the convolved co-occurrence matrix are translated back to two genomic regions (
 and
and  ) that are annotated as being co-aberrated across the tumor set. e. For the n-th peak in the Convolved Co-occurrence Matrix (CCM) two gene sets,
  and
and  , are defined, based on a 2σ window centered on the peak. f1. Using a protein-protein interaction database the interactions between gene sets derived from a single co-occurrence peak are analyzed, producing a set of interactions (
 ). f2. Using the Cancer Gene Census we inspect the resulting gene sets for presence of known tumor-suppressor genes and oncogenes.
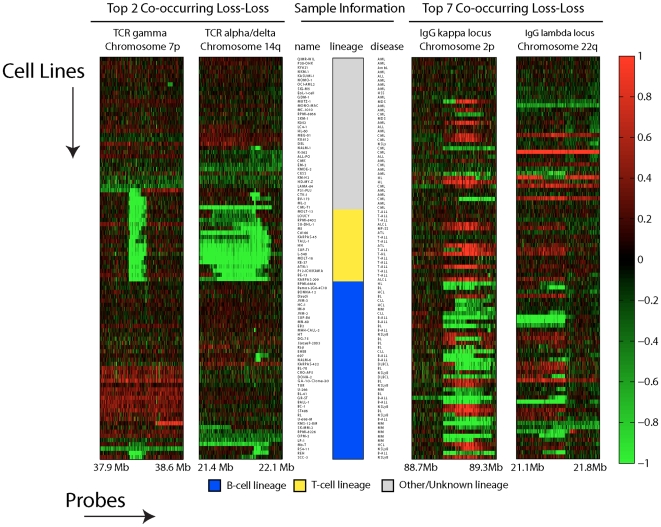

Similar articles
-
Genome-wide analysis of recurrent copy-number alterations and copy-neutral loss of heterozygosity in head and neck squamous cell carcinoma.J Oral Pathol Med. 2014 Jan;43(1):20-7. doi: 10.1111/jop.12087. Epub 2013 Jun 10. J Oral Pathol Med. 2014. PMID: 23750501
-
Cross-species DNA copy number analyses identifies multiple 1q21-q23 subtype-specific driver genes for breast cancer.Breast Cancer Res Treat. 2015 Jul;152(2):347-56. doi: 10.1007/s10549-015-3476-2. Epub 2015 Jun 25. Breast Cancer Res Treat. 2015. PMID: 26109346 Free PMC article.
-
Network-guided analysis of genes with altered somatic copy number and gene expression reveals pathways commonly perturbed in metastatic melanoma.PLoS One. 2011 Apr 8;6(4):e18369. doi: 10.1371/journal.pone.0018369. PLoS One. 2011. PMID: 21494657 Free PMC article.
-
Multi-OMICs and Genome Editing Perspectives on Liver Cancer Signaling Networks.Biomed Res Int. 2016;2016:6186281. doi: 10.1155/2016/6186281. Epub 2016 Jun 14. Biomed Res Int. 2016. PMID: 27403431 Free PMC article. Review.
-
Measurement and relevance of neuroblastoma DNA copy number changes in the post-genome era.Cancer Lett. 2005 Oct 18;228(1-2):83-90. doi: 10.1016/j.canlet.2005.02.052. Cancer Lett. 2005. PMID: 15967571 Review.
Cited by
-
Chromosomal Instability, Selection and Competition: Factors That Shape the Level of Karyotype Intra-Tumor Heterogeneity.Cancers (Basel). 2022 Oct 12;14(20):4986. doi: 10.3390/cancers14204986. Cancers (Basel). 2022. PMID: 36291770 Free PMC article. Review.
-
Discovery of cancer common and specific driver gene sets.Nucleic Acids Res. 2017 Jun 2;45(10):e86. doi: 10.1093/nar/gkx089. Nucleic Acids Res. 2017. PMID: 28168295 Free PMC article.
-
Discovery of co-occurring driver pathways in cancer.BMC Bioinformatics. 2014 Aug 9;15(1):271. doi: 10.1186/1471-2105-15-271. BMC Bioinformatics. 2014. PMID: 25106096 Free PMC article.
-
KC-SMARTR: An R package for detection of statistically significant aberrations in multi-experiment aCGH data.BMC Res Notes. 2010 Nov 11;3:298. doi: 10.1186/1756-0500-3-298. BMC Res Notes. 2010. PMID: 21070656 Free PMC article.
-
CDCOCA: a statistical method to define complexity dependence of co-occuring chromosomal aberrations.BMC Med Genomics. 2011 Mar 3;4:21. doi: 10.1186/1755-8794-4-21. BMC Med Genomics. 2011. PMID: 21371302 Free PMC article.
References
-
- Hanahan D, Weinberg RA. The Hallmarks of Cancer. Cell. 2000;100:57–70. - PubMed
-
- Michor F, Iwasa Y, Nowak M. Dynamics of cancer progression. Nat Rev Cancer. 2004;4:197–205. - PubMed
-
- de Ridder J, Kool J, Uren A, Bot J, Wessels L, et al. Co-occurrence analysis of insertional mutagenesis data reveals cooperating oncogenes. Bioinformatics. 2007;23:i133. - PubMed
-
- Thomas R, Baker A, DeBiasi R, Winckler W, LaFramboise T, et al. High-throughput oncogene mutation profiling in human cancer. Nat Genet. 2007;39:347–351. - PubMed
-
- Rajagopalan H, Nowak M, Vogelstein B, Lengauer C. The significance of unstable chromosomes in colorectal cancer. Nat Rev Cancer. 2003;3:695–701. - PubMed
Publication types
MeSH terms
Substances
LinkOut - more resources
Full Text Sources
