. 2010 Jan;6(1):e1000632.
doi: 10.1371/journal.pcbi.1000632. Epub 2010 Jan 1.

Modeling mitochondrial bioenergetics with integrated volume dynamics

Affiliations

Modeling mitochondrial bioenergetics with integrated volume dynamics

Jason N Bazil et al. PLoS Comput Biol. 2010 Jan.

Abstract

Mathematical models of mitochondrial bioenergetics provide powerful analytical tools to help interpret experimental data and facilitate experimental design for elucidating the supporting biochemical and physical processes. As a next step towards constructing a complete physiologically faithful mitochondrial bioenergetics model, a mathematical model was developed targeting the cardiac mitochondrial bioenergetic based upon previous efforts, and corroborated using both transient and steady state data. The model consists of several modified rate functions of mitochondrial bioenergetics, integrated calcium dynamics and a detailed description of the K(+)-cycle and its effect on mitochondrial bioenergetics and matrix volume regulation. Model simulations were used to fit 42 adjustable parameters to four independent experimental data sets consisting of 32 data curves. During the model development, a certain network topology had to be in place and some assumptions about uncertain or unobserved experimental factors and conditions were explicitly constrained in order to faithfully reproduce all the data sets. These realizations are discussed, and their necessity helps contribute to the collective understanding of the mitochondrial bioenergetics.


Conflict of interest statement

The authors have declared that no competing interests exist.

Figures

Figure 1
Figure 1. A graphical representation of the bioenergetic elements and processes described by the model.
Abbreviations: Oxphos, oxidative phosphorylation elements; PYR, pyruvate; CoASH, coenzyme A; AcCoA, acetyl-coenzyme A; CIT, citrate; ISOC, isocitrate; αKG, α-ketoglutarate; SCoA, succinyl CoA; SUC, succinate; FUM, fumarate; MAL, malate; OAA, oxaloacetate; GLU, glutamate; ASP, aspartate; NADH, reduced nicotinamide adenine dinucleotide; NAD, GTP, guanidine triphosphate; GDP, guanidine diphosphate; oxidized nicotinamide adenine dinucleotide; Pi, inorganic phosphate; UQ, ubiquinone; UQH2, ubiquinol; Cytc3+, oxidized cytochrome c; Cytc2+, reduced cytochrome c; PDH, pyruvate dehydrogenase; CS, citrate synthase; ACH, acontinase; IDH, isocitrate dehydrogenase; αKGDH, α-ketoglutarate dehydroganse; SCoAS; succinyl CoA synthetase; SDH, succinate dyhdrogenase; FH, fumarate hydratase; MDH, malate dehydrogenase; GOT, glutamate oxaloacetate transaminase; CI, Complex I; CIII, Complex III; CIV, Complex IV; mHleak, proton leak; F1FO, F1FO ATP synthase; ANT, adenine nucleotide transporter; PIC, inorganic phosphate carrier; GAE, glutamate/aspartate exchanger; OME, α-ketoglutarate/malate exchanger; DCC, dicarboxylate carrier; TCC, tricarboxylate carrier; PYRH, pyruvate-proton cotransporter; GLUH, glutamate-proton cotransporter; mKATP, ATP-dependent K+ channel; mKHE, K+/H+ exchanger; mKleak, K+ leak; mNHE, Na+/H+ exchanger; mNCE, Na+/Ca2+ exchanger; CaUNI, Ca2+ uniporter; AK, adenylate kinase.
Figure 2
Figure 2. Model simulations (lines) of the Pi control exerted over mitochondrial bioenergetics shown in comparison with isolated mitochondria experimental data (symbols) for the conditions outlined in Bose et al. .
Mitochondria were incubated in the assay buffer identified in the Methods section under the Bose data set description. State 2 simulation results and experimental data are shown as solid lines and circles, respectively. State 3 simulations results and experimental data are shown as dotted lines and squares, respectively. The simulated Pi-titration response is shown with the experimentally measured data for the A) MVO2, B) redox state (percent NADH), C) Δψ, D) reduced cytochrome c (percent c2+), E) matrix pH and F) the simulated matrix volume.
Figure 3
Figure 3. Model simulations (lines) of pyruvate/malate supported respiration on the levels of various TCA cycle intermediates compared with isolated mitochondria experimental data (symbols) for the conditions outlined in LaNoue et al. .
Mitochondria were incubated in the assay buffer identified in the Methods section under the LaNoue data set description. State 2 simulation results and experimental data are shown as solid lines and circles, respectively. State 3 simulations results and experimental data are shown as dotted lines and squares, respectively. The simulated TCA intermediate dynamics is shown with the experimentally measured data for A) the pyruvate utilization, B) the accumulation of lumped citrate and isocitrate, C) the accumulation of extra-mitochondrial lumped citrate and isocitrate, D) the accumulation of α-ketoglutarate, E) the accumulation of succinate and F) the residual malate content.
Figure 4
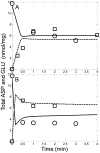
Figure 4. Model simulations (lines) of pyruvate supported respiration on the levels of the amino acids aspartate and glutamate in comparison with isolated mitochondria experimental data (symbols) for the conditions outlined in LaNoue et al. .
Mitochondria were incubated in the assay buffer identified in the Methods section under the LaNoue data set description. The simulated accumulation of aspartate (solid line) and glutamate (dotted line) are shown with experimentally measured aspartate (circles) and glutamate (squares). A) State 2, B) State 3.
Figure 5
Figure 5. Model simulations (lines) of the steady state matrix free calcium relationship with respect to varying extra-mitochondrial calcium levels in comparison with isolated mitochondria experimental data (symbols) for the conditions outlined in Wan et al. .
Mitochondria were incubated in the assay buffer identified in the Methods section under the Wan data set description. The steady state matrix free calcium concentration is shown versus varying extra-mitochondrial calcium in the presence of 2 (solid line, circles), 5 (dashed, squares) and 20 (dotted line, diamonds) mM NaCl with 5 mM MgCl2.
Figure 6
Figure 6. Model simulations (lines) of the matrix volume dynamics under various altered states of the mitochondrial bioenergetics shown in comparison with isolated mitochondria experimental data (symbols) for the conditions outlined in Kowaltowski et al. .
Mitochondria were incubated in the assay buffer identified in the Methods section under the Kowaltowski data set description. A small amount of ATP, 200 µM, was included in the assay buffer with either 0.5 µg/mg oligomycin (solid line, circles), 1 mM ADP (dashed line, squares) or 0.5 µg/mg oligomycin+1 mM ADP (dotted line, diamonds). In a separate experiment, no ATP was included in the assay buffer with 0.5 µg/ml oligomycin (dash-dot line, triangles).
Figure 7
Figure 7. Model predictions (line) of the steady state extra-mitochondrial α-ketoglutarate concentrations during state 2 respiration with various extra-mitochondrial malate concentrations (symbols) is compared to the experimentally reported values outlined in LaNoue et al. .
Mitochondria were incubated in the assay buffer identified in the Methods section under the LaNoue data set description. Extra-mitochondrial malate was incrementally increased from 0 to 5 mM in the presence of 2 mM pyruvate. The model was simulated at sufficient times to achieve α-ketoglutarate steady state concentrations.
Figure 8
Figure 8. Model predictions (lines) of mitochondrial volume in comparison with isolated mitochondria experimental data (symbols) for the conditions outlined in Kowaltowski et al. .
Mitochondria were incubated in the assay buffer identified in the Methods section under the Kowaltowski data set description. A) In each case, 200 µM ATP was included in the assay buffer. Volume dynamics were then measured with either 1 mM ADP and 30 µM diazoxide (solid line, circles) or 1 mM ADP, 30 µM diazoxide and 300 µM 5-hydroxydecanoate (dashed line, sqaures) added to the assay buffer. B) In each case, 0.5 ug/ml oligomycin was included in the assay buffer. Volume dynamics were then measured with either 200 µM ATP (dashed line, circles); 200 µM ATP and 30 µM diazoxide (solid line, square) or 200 µM ATP, 30 µM diazoxide and 300 µM 5-hydroxydecanoate (dash-dot line, diamond) added to the assay buffer (note, the dash-dot line is hidden by the solid line).
Figure 9
Figure 9. Model predictions (lines) of mitochondrial bioenergetic parameters under differing osmotic KCl medium with isolated mitochondria experimental data (symbols) for the conditions outlined in Devin et al. .
Mitochondria were incubated in the assay buffer identified in the Methods section under the Devin data set description. As the osmotic pressure of the KCl medium was adjusted from hypoosmotic to hyperosmotic conditions, A) MVO2, B) Δψ, C) ΔpH (defined as pHmtx-pHcyt), D) proton motive force (Δψ+2.303RT/FΔpH), E) %NADH level and F) matrix volume predicted by the model is presented.

Similar articles

Cited by

References

    1. Wu F, Yang F, Vinnakota KC, Beard DA. Computer modeling of mitochondrial tricarboxylic acid cycle, oxidative phosphorylation, metabolite transport, and electrophysiology. J Biol Chem. 2007;282:24525–24537. - PubMed
    1. Nguyen MH, Dudycha SJ, Jafri MS. Effect of Ca2+ on cardiac mitochondrial energy production is modulated by Na+ and H+ dynamics. Am J Physiol Cell Physiol. 2007;292:C2004–2020. - PubMed
    1. Cortassa S, Aon MA, O'Rourke B, Jacques R, Tseng HJ, et al. A computational model integrating electrophysiology, contraction, and mitochondrial bioenergetics in the ventricular myocyte. Biophys J. 2006;91:1564–1589. - PMC - PubMed
    1. Korzeniewski B, Zoladz JA. A model of oxidative phosphorylation in mammalian skeletal muscle. Biophys Chem. 2001;92:17–34. - PubMed
    1. Nazaret C, Heiske M, Thurley K, Mazat JP. Mitochondrial energetic metabolism: a simplified model of TCA cycle with ATP production. J Theor Biol. 2009;258:455–464. - PubMed

Publication types