

Disentangling direct from indirect co-evolution of residues in protein alignments
- PMID: 20052271
- PMCID: PMC2793430
- DOI: 10.1371/journal.pcbi.1000633
Disentangling direct from indirect co-evolution of residues in protein alignments
Abstract
Predicting protein structure from primary sequence is one of the ultimate challenges in computational biology. Given the large amount of available sequence data, the analysis of co-evolution, i.e., statistical dependency, between columns in multiple alignments of protein domain sequences remains one of the most promising avenues for predicting residues that are contacting in the structure. A key impediment to this approach is that strong statistical dependencies are also observed for many residue pairs that are distal in the structure. Using a comprehensive analysis of protein domains with available three-dimensional structures we show that co-evolving contacts very commonly form chains that percolate through the protein structure, inducing indirect statistical dependencies between many distal pairs of residues. We characterize the distributions of length and spatial distance traveled by these co-evolving contact chains and show that they explain a large fraction of observed statistical dependencies between structurally distal pairs. We adapt a recently developed Bayesian network model into a rigorous procedure for disentangling direct from indirect statistical dependencies, and we demonstrate that this method not only successfully accomplishes this task, but also allows contacts with weak statistical dependency to be detected. To illustrate how additional information can be incorporated into our method, we incorporate a phylogenetic correction, and we develop an informative prior that takes into account that the probability for a pair of residues to contact depends strongly on their primary-sequence distance and the amount of conservation that the corresponding columns in the multiple alignment exhibit. We show that our model including these extensions dramatically improves the accuracy of contact prediction from multiple sequence alignments.
Conflict of interest statement
The authors have declared that no competing interests exist.
Figures


 -values (horizontal axis) for structurally close (red) and distal (blue) residue pairs. Right panel: The fraction of all residue pairs that are distal in the structure as a function of their statistical dependency (
 -value).
 letters (A through E) represent
  residues and their distances in the figure reflect their distances in the three-dimensional structure. We assume that the pairs A–B, B–C, and D–E are in contact and interact directly. The thickness of the edges between pairs of nodes reflect the statistical dependencies between the corresponding columns in the multiple alignment.
 and
and  can be connected indirectly via a chain of contacts (
 ) through nodes
  and
and  (in blue) whose edges all have higher dependency (i.e.
  ,
,  and
and  ).
).
 (
( ) that co-evolve (
 ) that can be explained by chains of co-evolving contacts as a function of the score
  of the best chain (see text). The blue line shows the distribution for the true data and the red curve for the randomized data. Right panel: Ratio (fold-enrichment) of the fraction of distal co-evolving pairs that can be explained by chains versus the fraction that can be explained by chains from the randomized data. The vertical axis is shown on a logarithmic scale.
 . The vertical axis is shown on a logarithmic scale. The dotted line shows a fit to an exponential distribution
  . Right panel: Number of steps in the shortest co-evolving contact chain as a function of the spatial distance of the co-evolving pair. The blue line shows the mean distance and the red dotted lines show mean plus and minus one standard deviation. The black dotted line shows a linear fit, the fitted slope of which corresponds to an increase in distance by
  Å per additional contact in the chain.
 columns. The posterior probability for edge
  is the statistical weight of all spanning trees that contain this edge relative to the weight of all possible spanning trees.
 (blue), and the posterior probabilities (red). The vertical axis shows mean positive predictive value (PPV, solid line) plus and minus one standard error (dashed lines) as a function of sensitivity (horizontal axis, shown on a logarithmic scale). The left panel shows predictions for all residue pairs, the middle using only predictions for residues separated by at least
  positions in the primary sequence, and the right panel for pairs separated by at least
  positions.
 ) that can be explained by contact chains of scores
  (red),
  (dark blue),
  (light blue), and for all distal co-evolving pairs (green). For comparison the reverse cumulative distribution of posteriors for co-evolving contacts (
 ) is also shown (black).
 (red) as a function of the
  -value of the
  statistic (horizontal axis). The solid lines show the medians of the distributions and the dashed lines the
  th and
  th percentiles.

 . The solid blue line shows the mean, the dashed blue lines the mean
  one standard error. The dashed black line shows the function
  . Right panel: The
  -value distribution of the
  statistics for all contacting pairs at different primary sequence separations. The blue line represents the median and the red lines represent the
  th,
th,  th,
th,  th and
  th percentiles, respectively. The
  -value was calculated with respect to the mean and standard deviation of the
  distribution of all pairs (including distal ones). In both panels only sequence separations up to
  residues are shown as the curves become very noisy for larger sequence separations.
 one standard error. The right panel shows the Z-value distribution of both
  (blue) and
  (red) for all contacting pairs versus the sum of entropies of the corresponding columns. The solid lines denote the medians and the dashed lines the 25th and 75th percentiles.
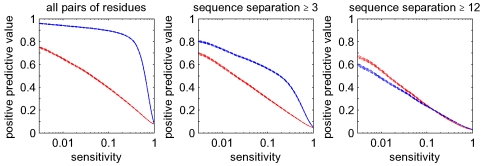

 in red,
  in green,
  in black and
  in magenta). For the sake of clarity, only a few selected entropy bins across the entire range are shown. The right panel shows the estimated function
  , which describes how the probability of an edge to be a contact depends on the sum of entropies of the corresponding columns of the alignment (see text).
References
-
- Eddy S. Profile hidden markov models. Bioinformatics. 1998;14:755–763. - PubMed
-
- Lindgreen S, Gardner P, Krogh A. Measuring covariation in RNA alignments: physical realism improves information measures. Bioinformatics. 2006;22(24):2988–2995. - PubMed
-
- Yanovsky C, Horn V, Thorpe D. Protein structure relationships revealed by mutational analysis. Science. 1964;146:1593–1594. - PubMed
Publication types
MeSH terms
Substances
LinkOut - more resources
Full Text Sources
Other Literature Sources
