

5-Lipoxygenase DNA methylation and mRNA content in the brain and heart of young and old mice
- PMID: 20052386
- PMCID: PMC2801004
- DOI: 10.1155/2009/209596
5-Lipoxygenase DNA methylation and mRNA content in the brain and heart of young and old mice
Abstract
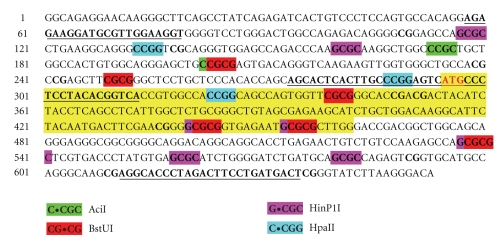
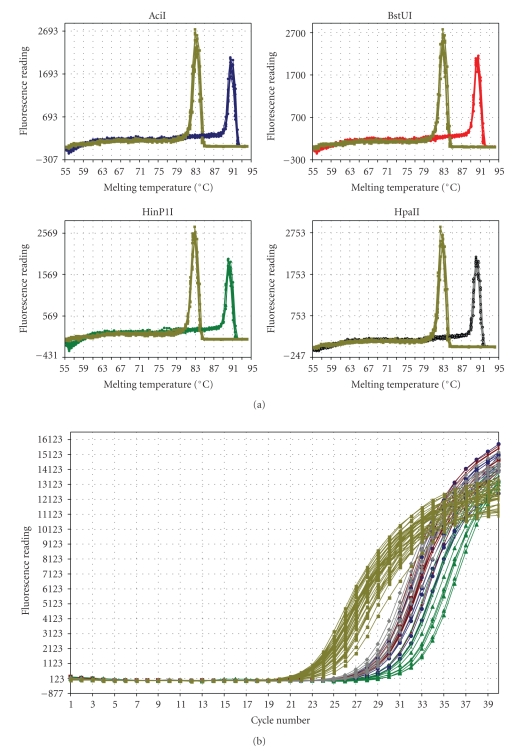
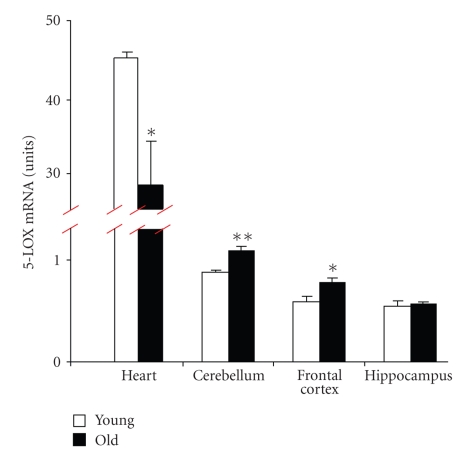
The expression of 5-lipoxygenase (5-LOX) is affected by aging and regulated by epigenetic mechanisms including DNA methylation. We used methylation-sensitive restriction endonucleases (AciI, BstUI, HpaII, and HinP1I) to assess 5-LOX DNA methylation in brain and heart tissue samples from young (2 months) and old (22 months) mice. We also measured mRNA content for 5-LOX and the DNA methyltransferases DNMT1 and DNMT3a. In young mice, the 5-LOX mRNA content was significantly greater in the heart compared to the brain; 5-LOX DNA methylation was lower, except in the AciI assay in which it was higher in the heart. Aging decreased 5-LOX mRNA content in the heart and increased it in the brain. Aging also increased 5-LOX DNA methylation and this effect was site- (i.e., enzyme) and tissue-specific. Generally, DNMT1 and DNMT3a mRNA content was lower in the brain regions compared to the heart; the only effect of aging was observed in the mRNA content of DNMT3a, which was decreased in the heart of old mice. These results indicate a complex tissue-specific and aging-dependent interplay between the DNA methylation system and 5-LOX mRNA content. Interpretation of this data must take into account that the tissue samples contained a mixture of various cell types.
Figures


Similar articles
-
5-Lipoxygenase and epigenetic DNA methylation in aging cultures of cerebellar granule cells.Neuroscience. 2009 Dec 29;164(4):1531-7. doi: 10.1016/j.neuroscience.2009.09.039. Epub 2009 Sep 22. Neuroscience. 2009. PMID: 19778587 Free PMC article.
-
5-Lipoxygenase in mouse cerebellar Purkinje cells.Neuroscience. 2010 Dec 1;171(2):383-9. doi: 10.1016/j.neuroscience.2010.09.019. Epub 2010 Sep 17. Neuroscience. 2010. PMID: 20851170 Free PMC article.
-
Homocysteine suppresses the expression of the collagen cross-linker lysyl oxidase involving IL-6, Fli1, and epigenetic DNA methylation.J Biol Chem. 2011 Feb 18;286(7):5578-88. doi: 10.1074/jbc.M110.166181. Epub 2010 Dec 9. J Biol Chem. 2011. PMID: 21148317 Free PMC article.
-
A method to detect DNA methyltransferase I gene transcription in vitro in aging systems.Methods Mol Biol. 2007;371:73-80. doi: 10.1007/978-1-59745-361-5_6. Methods Mol Biol. 2007. PMID: 17634574 Free PMC article. Review.
-
Putative role of neuronal 5-lipoxygenase in an aging brain.FASEB J. 2000 Jul;14(10):1464-9. doi: 10.1096/fj.14.10.1464. FASEB J. 2000. PMID: 10877840 Review.
Cited by
-
Homocysteine modulates 5-lipoxygenase expression level via DNA methylation.Aging Cell. 2017 Apr;16(2):273-280. doi: 10.1111/acel.12550. Epub 2016 Nov 29. Aging Cell. 2017. PMID: 27896923 Free PMC article.
-
Effect of aging on 5-hydroxymethylcytosine in the mouse hippocampus.Restor Neurol Neurosci. 2012;30(3):237-45. doi: 10.3233/RNN-2012-110223. Restor Neurol Neurosci. 2012. PMID: 22426040 Free PMC article.
-
Epigenetics in Heart Failure: Role of DNA Methylation in Potential Pathways Leading to Heart Failure with Preserved Ejection Fraction.Biomedicines. 2023 Oct 17;11(10):2815. doi: 10.3390/biomedicines11102815. Biomedicines. 2023. PMID: 37893188 Free PMC article. Review.
-
Cyclooxygenases and 5-lipoxygenase in Alzheimer's disease.Prog Neuropsychopharmacol Biol Psychiatry. 2011 Mar 30;35(2):315-9. doi: 10.1016/j.pnpbp.2010.07.032. Epub 2010 Aug 5. Prog Neuropsychopharmacol Biol Psychiatry. 2011. PMID: 20691748 Free PMC article. Review.
-
Effect of valproic acid on mitochondrial epigenetics.Eur J Pharmacol. 2012 Sep 5;690(1-3):51-9. doi: 10.1016/j.ejphar.2012.06.019. Epub 2012 Jun 20. Eur J Pharmacol. 2012. PMID: 22728245 Free PMC article.
References
-
- Rådmark O, Werz O, Steinhilber D, Samuelsson B. 5-lipoxygenase: regulation of expression and enzyme activity. Trends in Biochemical Sciences. 2007;32(7):332–341. - PubMed
-
- Duroudier NP, Tulah AS, Sayers I. Leukotriene pathway genetics and pharmacogenetics in allergy. Allergy. 2009;64(6):823–839. - PubMed
-
- Rådmark O, Samuelsson B. 5-lipoxygenase: regulation and possible involvement in atherosclerosis. Prostaglandins and Other Lipid Mediators. 2007;83(3):162–174. - PubMed
-
- Evans JF, Ferguson AD, Mosley RT, Hutchinson JH. What's all the FLAP about?: 5-lipoxygenase-activating protein inhibitors for inflammatory diseases. Trends in Pharmacological Sciences. 2008;29(2):72–78. - PubMed
Publication types
MeSH terms
Substances
Grants and funding
LinkOut - more resources
Full Text Sources
Medical
