

Magnetic resonance water proton relaxation in protein solutions and tissue: T(1rho) dispersion characterization
- PMID: 20052404
- PMCID: PMC2797329
- DOI: 10.1371/journal.pone.0008565
Magnetic resonance water proton relaxation in protein solutions and tissue: T(1rho) dispersion characterization
Abstract
Background: Image contrast in clinical MRI is often determined by differences in tissue water proton relaxation behavior. However, many aspects of water proton relaxation in complex biological media, such as protein solutions and tissue are not well understood, perhaps due to the limited empirical data.
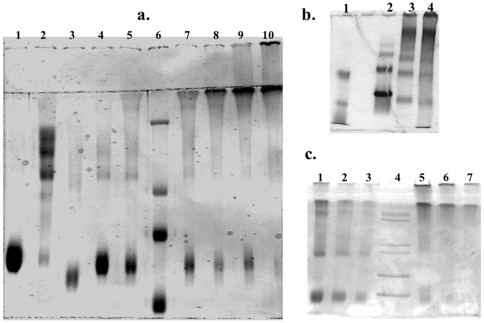
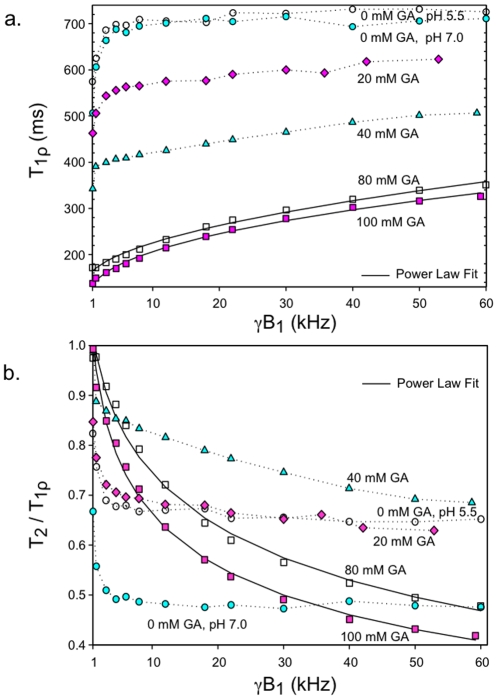
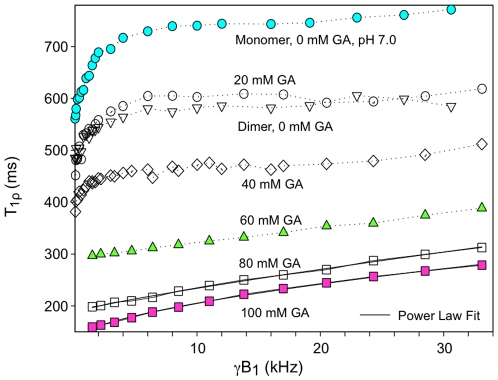
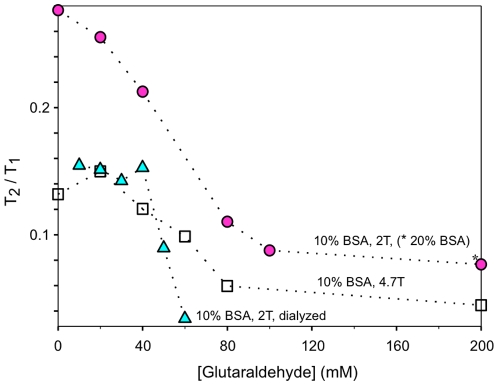
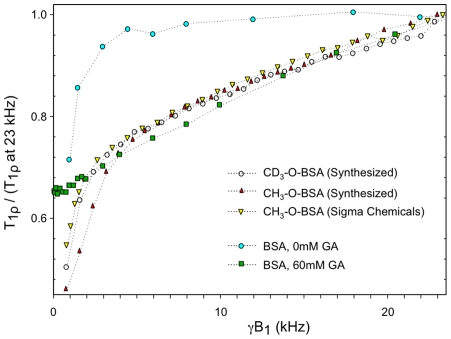
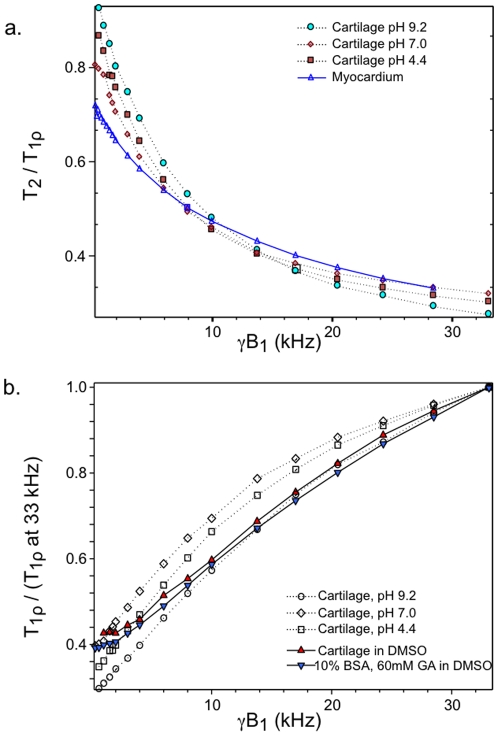
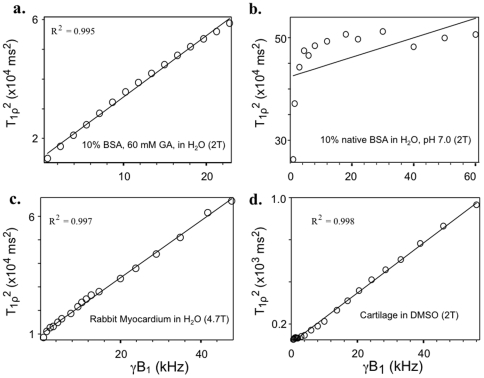
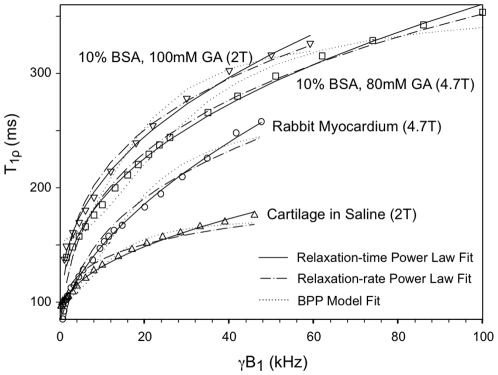
Principal findings: Water proton T(1), T(2), and T(1rho) of protein solutions and tissue were measured systematically under multiple conditions. Crosslinking or aggregation of protein decreased T(2) and T(1rho), but did not change high-field T(1). T(1rho) dispersion profiles were similar for crosslinked protein solutions, myocardial tissue, and cartilage, and exhibited power law behavior with T(1rho)(0) values that closely approximated T(2). The T(1rho) dispersion of mobile protein solutions was flat above 5 kHz, but showed a steep curve below 5 kHz that was sensitive to changes in pH. The T(1rho) dispersion of crosslinked BSA and cartilage in DMSO solvent closely resembled that of water solvent above 5 kHz but showed decreased dispersion below 5 kHz.
Conclusions: Proton exchange is a minor pathway for tissue T(1) and T(1rho) relaxation above 5 kHz. Potential models for relaxation are discussed, however the same molecular mechanism appears to be responsible across 5 decades of frequencies from T(1rho) to T(1).
Conflict of interest statement
Figures
Similar articles
-
Water magnetic relaxation dispersion in biological systems: the contribution of proton exchange and implications for the noninvasive detection of cartilage degradation.Proc Natl Acad Sci U S A. 2001 Oct 23;98(22):12479-84. doi: 10.1073/pnas.221471898. Epub 2001 Oct 16. Proc Natl Acad Sci U S A. 2001. PMID: 11606754 Free PMC article.
-
Observation of bi-exponential T(1ρ) relaxation of in-vivo rat muscles at 3T.Acta Radiol. 2012 Jul;53(6):675-81. doi: 10.1258/ar.2012.120108. Epub 2012 Jul 3. Acta Radiol. 2012. PMID: 22761346
-
T1rho Dispersion profile of rat tissues in vitro at very low locking fields.Magn Reson Imaging. 2006 Apr;24(3):295-9. doi: 10.1016/j.mri.2005.04.011. Epub 2006 Feb 2. Magn Reson Imaging. 2006. PMID: 16563959
-
Effects of intracellular pH, blood, and tissue oxygen tension on T1rho relaxation in rat brain.Magn Reson Med. 2002 Sep;48(3):470-7. doi: 10.1002/mrm.10233. Magn Reson Med. 2002. PMID: 12210911
-
Magnetic resonance characterization of tissue engineered cartilage via changes in relaxation times, diffusion coefficient, and shear modulus.Crit Rev Biomed Eng. 2014;42(2):137-91. doi: 10.1615/critrevbiomedeng.2014011843. Crit Rev Biomed Eng. 2014. PMID: 25403876 Review.
Cited by
-
Compact NMR relaxometry of human blood and blood components.Trends Analyt Chem. 2016 Nov;83(A):53-64. doi: 10.1016/j.trac.2016.04.020. Trends Analyt Chem. 2016. PMID: 28003711 Free PMC article.
-
Rapid estimation approach for glycosylated serum protein of human serum based on the combination of deep learning and TD-NMR technology.Anal Sci. 2023 Jun;39(6):957-968. doi: 10.1007/s44211-023-00303-x. Epub 2023 Mar 10. Anal Sci. 2023. PMID: 36897540
-
Determination of Methemoglobin in Hemoglobin Submicron Particles Using NMR Relaxometry.Int J Mol Sci. 2020 Nov 26;21(23):8978. doi: 10.3390/ijms21238978. Int J Mol Sci. 2020. PMID: 33256027 Free PMC article.
-
T2-weighted imaging to assess post-infarct myocardium at risk.JACC Cardiovasc Imaging. 2011 Sep;4(9):1014-21. doi: 10.1016/j.jcmg.2011.07.005. JACC Cardiovasc Imaging. 2011. PMID: 21920341 Free PMC article. No abstract available.
-
Contributions of chemical exchange to T1ρ dispersion in a tissue model.Magn Reson Med. 2011 Dec;66(6):1563-71. doi: 10.1002/mrm.22947. Epub 2011 May 16. Magn Reson Med. 2011. PMID: 21590720 Free PMC article.
References
-
- Bloembergen N, Purcell EM, Pound RV. Relaxation effects in nuclear magnetic resonance absorption. Phys Rev. 1948;73:679–712.
-
- Fullerton GD. Physiologic basis of magnetic relaxation. In: Stark DD, Bradley WG , editors. Magnetic Resonance Imaging. Vol 1, 2 edition. St. Louis: Mosby Year Book; 1980. pp. 88–108.
-
- Bryant RG, Mendelson DA, Lester CC. The magnetic field dependence of proton spin relaxation in tissues. Magn Reson Med. 1991;21:117–126. - PubMed
-
- Koenig SH, Brown RD., 3rd A molecular theory of relaxation and magnetization transfer: application to cross-linked BSA, a model for tissue. Magn Reson Med. 1993;30:685–695. - PubMed
-
- Zhou D, Bryant RG. Magnetization transfer, cross-relaxation, and chemical exchange in rotationally immobilized protein gels. Magn Reson Med. 1994;32:725–732. - PubMed
MeSH terms
Substances
LinkOut - more resources
Full Text Sources
Medical
