. 2010 Jan 5;5(1):e8575.
doi: 10.1371/journal.pone.0008575.

Mild hypoxia enhances proliferation and multipotency of human neural stem cells

Affiliations

Mild hypoxia enhances proliferation and multipotency of human neural stem cells

Guido Santilli et al. PLoS One. .

Abstract

Background: Neural stem cells (NSCs) represent an optimal tool for studies and therapy of neurodegenerative diseases. We recently established a v-myc immortalized human NSC (IhNSC) line, which retains stem properties comparable to parental cells. Oxygen concentration is one of the most crucial environmental conditions for cell proliferation and differentiation both in vitro and in vivo. In the central nervous system, physiological concentrations of oxygen range from 0.55 to 8% oxygen. In particular, in the in the subventricular zone niche area, it's estimated to be 2.5 to 3%.

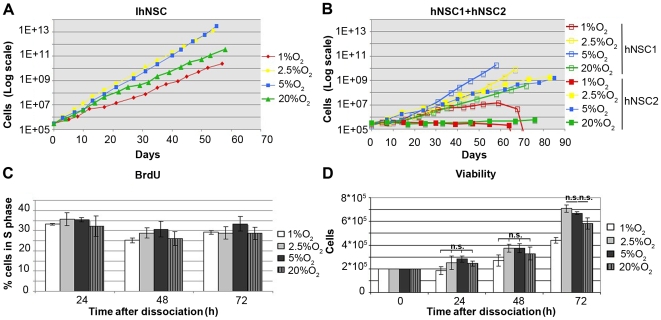
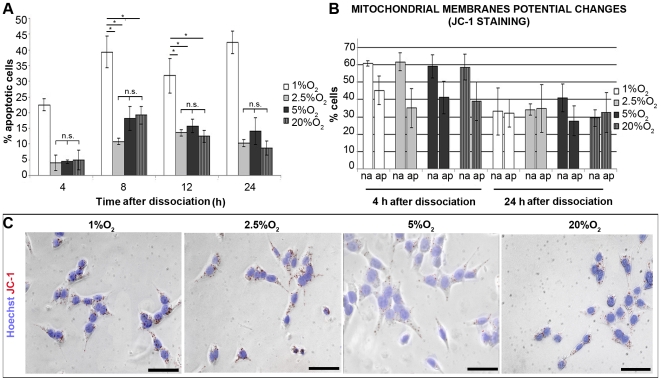
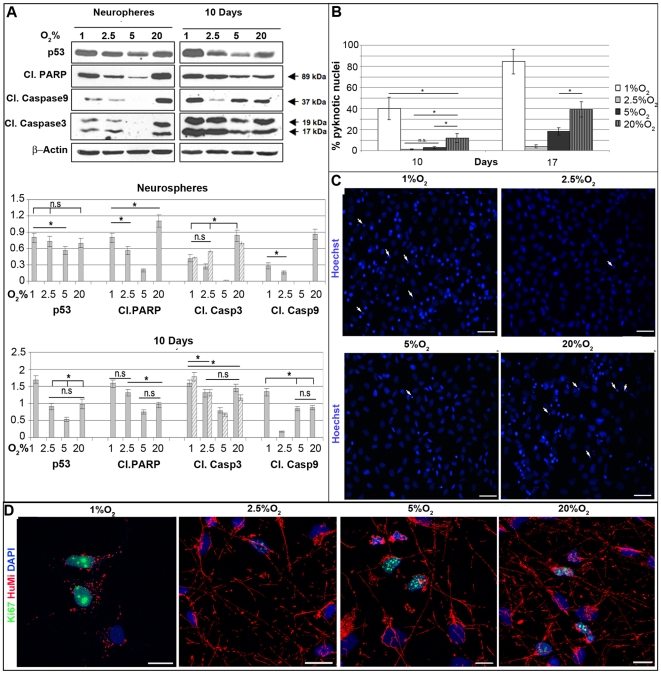
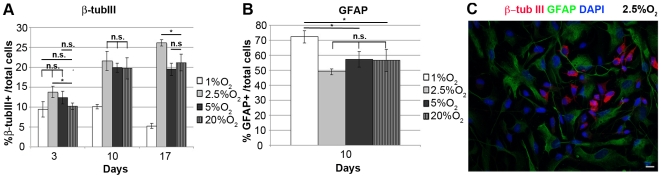
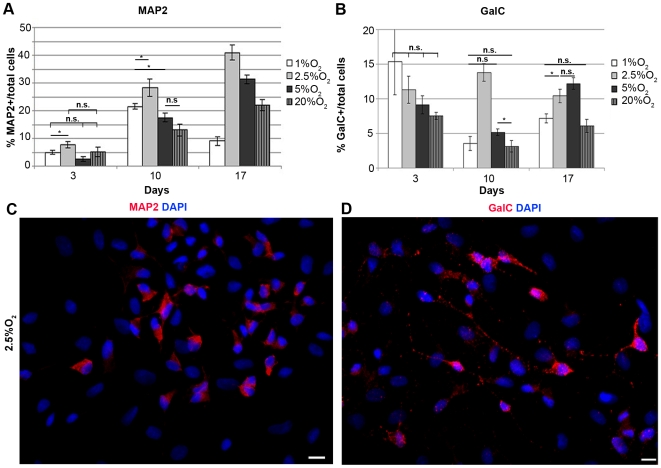
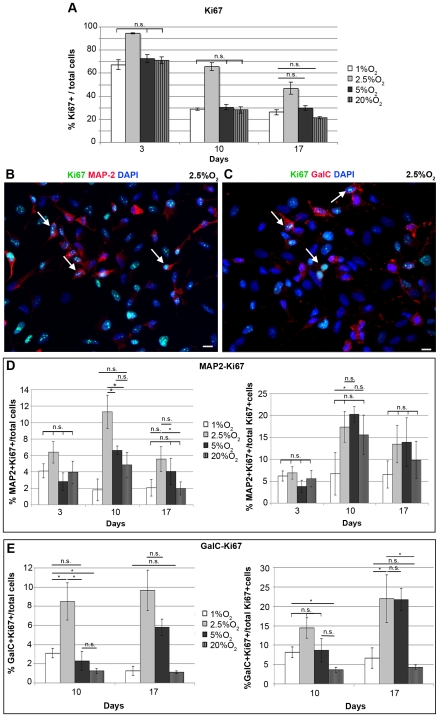
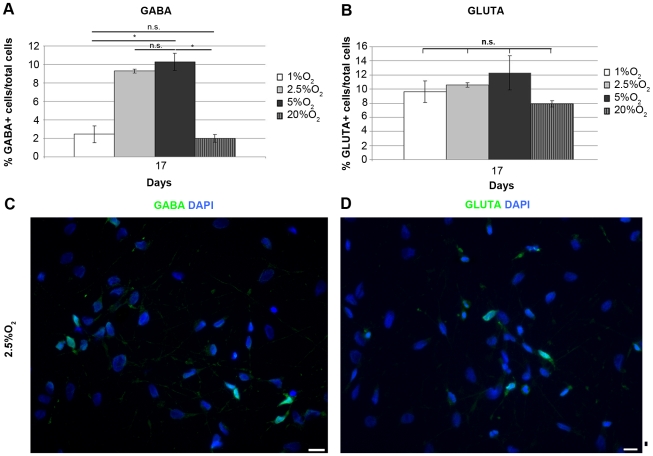
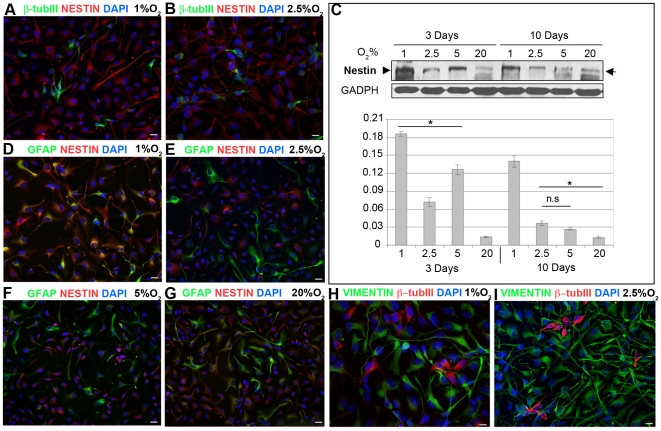
Methodology/principal findings: We investigated in vitro the effects of 1, 2.5, 5, and 20% oxygen concentrations on IhNSCs both during proliferation and differentiation. The highest proliferation rate, evaluated through neurosphere formation assay, was obtained at 2.5 and 5% oxygen, while 1% oxygen was most noxious for cell survival. The differentiation assays showed that the percentages of beta-tubIII+ or MAP2+ neuronal cells and of GalC+ oligodendrocytes were significantly higher at 2.5% compared with 1, 5, or 20% oxygen at 17 days in vitro. Mild hypoxia (2.5 to 5% oxygen) promoted differentiation into neuro-oligodendroglial progenitors as revealed by the higher percentage of MAP2+/Ki67+ and GalC+/Ki67+ residual proliferating progenitors, and enhanced the yield of GABAergic and slightly of glutamatergic neurons compared to 1% and 20% oxygen where a significant percentage of GFAP+/nestin+ cells were still present at 17 days of differentiation.

Conclusions/significance: These findings raise the possibility that reduced oxygen levels occurring in neuronal disorders like cerebral ischemia transiently lead to NSC remaining in a state of quiescence. Conversely, mild hypoxia favors NSC proliferation and neuronal and oligodendroglial differentiation, thus providing an important advance and a useful tool for NSC-mediated therapy of ischemic stroke and neurodegenerative diseases like Parkinson's disease, multiple sclerosis, and Alzheimer's disease.


Conflict of interest statement

Competing Interests: The authors have declared that no competing interests exist.

Figures

Figure 1
Figure 1. Mild hypoxia favors proliferation of IhNSC.
(A, B) Graphs showing the proliferation rate of IhNSC (A) and hNSC lines 1 and 2 (B) when cultured at different concentrations of O2. At each passage only 2×10⁵ cells are plated while the logarithmic value of the total cell number is calculated on the base of amplification rate at each passage (see material and methods) and plotted against the days in vitro from the beginning of the experiment (N = 2; one representative curve is shown). As shown in this figure, in mild hypoxia, it could be possible to generate more than 1×10¹³ (IhNSC) or 1×10¹⁰ (hNSC) from 2×10⁵ cells after 60 days from the first passage. (C) Histogram showing the percentage of IhNSC in S phase (obtained through BrdU assay, see methods) at 24, 48, 72 hours after dissociation (N = 3) at each oxygen culture condition. Values are means±S.E.M. No significant differences were detected. (D) Histogram showing the number of viable IhNSC after dissociation at 0, 24, 48 and 72 hours after dissociation. For each oxygen condition 200.000 cells were plated (N = 2). Values are means±S.E.M. At 72 hours cells cultured in 2.5% and 5% O2 the percentage of viable IhNSCs was significantly higher than at 1% O2 (p<0.001). The difference among all the values at the different oxygen concentrations was statistically significant (P<0.01) unless indicated (*P<0.05, n.s. = not significant); one-way ANOVA followed by the Student's t-test.
Figure 2
Figure 2. Survival of IhNSC at different O2 conditions.
(A) Histogram showing the percentage of apoptotic cells (assessed by TUNEL assay, see methods) at 4, 8, 12 and 24 hours from dissociation (N = 3). Values are means±S.E.M. At 1% O2 the percentage of apoptotic cells in culture is significantly higher than at other conditions at each time point (p<0.001 at 4h). The difference among all the values at the different oxygen concentrations was statistically significant (P<0.01) unless indicated (*P<0.05, n.s., = not significant); one-way ANOVA followed by the Student's t-test. (B) Graph showing the percentages of non apoptotic (na) or apoptotic (ap) cells as assessed by JC1 staining assay for the detection of cells with depolarized mitochondrial potential, corresponding to apoptotic cells (N = 2). Values are means±S.E.M. No significant differences were detected between the different conditions. (C) Representative images of live dissociated IhNSC in 1%, 2.5%, 5% and 20% oxygen plated onto an adhesive substrate and stained with the mitochondrial and nuclear dyes JC1 (red) and Hoechst (blue) at 4 hours upon dissociation. The images were obtained by merging the bright field and fluorescent (for JC1 and Hoechst) pictures of the cells. Scale bars: 10µm.
Figure 3
Figure 3. Survival and apoptosis during differentiation of IhNSC at different O2 conditions.
(A) Western blot analysis of the expression of apoptotic markers at neurosphere stage and at 10 days differentiation. Lysates were prepared from undifferentiated and differentiated IhNSCs grown at the indicated oxygen concentrations and immunoblotted with antibodies specific for cleaved PARP, cleaved caspases 9 and 3, p53 and β-actin, the latter to normalize bands for equal loading of proteins per lane. Bands were quantified by densitometry analysis of the ECL-exposed films. (B) Pyknotic nuclei detected at 10 and 17 days of differentiation (N = 3). Values are means±S.E.M. The difference among all the values at the different oxygen concentrations was statistically significant (P<0.01) unless indicated with an asterisk (*P<0.05, n.s. = not significant); one-way ANOVA followed by the Student's t-test. (C) Representative images of pyknotic nuclei (white arrows, Hoechst stain, blue) at 17 days of differentiation. (D) Representative images of mithocondria (HuMi, red) at 17days of differentiation. Note proliferating cells (Ki67+, green) and the different distribution of mithocondria at 1% O2 relative to other O2 concentrations. Scale bars: 20µm (C), 10µm (D). For A and B, the differences at different oxygen concentrations was statistically significant (P<0.01) unless indicated (*P<0.05, n.s.: not significant); one-way ANOVA followed by the Student's t-test.
Figure 4
Figure 4. Mild hypoxia increases the percentage of IhNSC-derived neurons during in vitro differentiation.
IhNSC were differentiated onto an adhesive substrate in medium without mitogens and fixed for immunocytochemical analysis after 3, 10 and 17 days in vitro. (A) Quantification of the percentage of neurons (β-tubIII+) over the total nuclei (DAPI+) number. Values are means±S.E.M (N = 3). Neurons were significantly less represented at 1% O2 with respect to the other O2 concentrations at 10 and 17 days in vitro. The difference among all the values at the different oxygen concentrations was statistically significant (P<0.01) unless indicated (*P<0.05), n.s., = not significant; one-way ANOVA followed by the Student's t-test.(B) Quantification of the percentage of astrocytes (GFAP+) over the total nuclei (DAPI+) number (N = 3). Values are means±S.E.M. At 10 days in vitro the percentage of astrocytes generated in 1% O2 was significantly (*p<0.05) higher with respect to the other conditions (1% O2 vs 2.5% O2, p<0.01). All other values were not significantly different (n.s., = not significant); one-way ANOVA followed by the Student's t-test. (C) Immunocytochemistry of differentiated cells showing the morphology of β-tubIII+ (red) and GFAP+ (green) cells in 2.5% oxygen at 10 days in vitro. Scale bar, 10µm.
Figure 5
Figure 5. Mild hypoxia enhances the percentage of IhNSC-derived mature neurons and oligodendrocytes during in vitro differentiation.
IhNSC were differentiated onto an adhesive substrate in medium without mitogens and fixed for immunocytochemical analysis at 3, 10 and 17 days. (A) Quantification of the percentage of mature neurons (MAP2+) over the total nuclei (DAPI+) number. Values are means±S.E.M (N = 3). At 10 and 17 days the percentages of MAP2+ neurons generated in 2.5% O2 were significantly higher with respect to the other conditions (B) Quantification of the percentage of oligodendrocytes (GalC+) over the total number of nuclei (DAPI+). Values are means±S.E.M (N = 3). At 10 days in vitro the percentages of GalC+ oligodendrocytess generated in 2.5% O2 were significantly higher with respect to the other conditions, while at 17days 2,5% and 5% O2 conditions generated comparable numbers of GalC+ cells. The differences among all the values at 1%, 2.5%, 5% and 20% oxygen was statistically significant (P<0.01) unless indicated (*P<0.05, n.s., = not significant); one-way ANOVA followed by the Student's t-test for all experiments. (C–D) Immunocytochemistry of differentiated cells showing the morphology of MAP2+ (red in C) and GalC+ (red in D) cells at 2.5% O2 at 10 days. Scale bars in C–D = 10µm.
Figure 6
Figure 6. Mild hypoxia supports the survival of IhNSC-derived proliferating neuronal and oligodendroglial progenitors.
IhNSCs were differentiated onto an adhesive substrate in medium without mitogens and fixed for immunocytochemical analysis at 3, 10 and 17 days. (A) Graph showing the percentage of proliferating (Ki67+) IhNSC cells over total nuclei (DAPI+) at 3, 10 and 17 days during in vitro differentiation. Values are means±S.E.M (N = 3). The 2.5% O2 resulted the most permissive condition to the proliferation of IhNSC-derived progenitors at each differentiation time. (B–C) Immunostaining showing the co-localization (arrows) between the nuclear proliferation marker Ki67 (green) with the neuronal MAP2 (red in B), and the oligodendroglial GalC (red in C) at 10 days. (D) Quantification of the percentage of proliferating neurons (MAP2+/Ki67+) over the total nuclei (DAPI+) number (left) and over the total of proliferating cells (Ki67+) number (right) at 3, 10 and 17 days. Values are means±S.E.M (N = 3). (E) Quantification of the percentage of proliferating oligodendrocytes (GalC+/Ki67+) over the total nuclei (DAPI+) number (left) and over the total of proliferating cells (Ki67+) number (right), at 10 and 17 days. Values are means±S.E.M (N = 3). The differences among all the values at 1%, 2.5%, 5% and 20% oxygen was statistically significant (P<0.01) unless indicated (*P<0.05, n.s., = not significant); one-way ANOVA followed by the Student's t-test for all experiments. Scale bars, (B–C) 10µm.
Figure 7
Figure 7. Oxygen regulates neurotrasmitter phenotypes of IhNSC-derived neurons.
IhNSCs were differentiated onto an adhesive substrate in medium without mitogens and fixed for immunocytochemical analysis at 3, 10 and 17 days. (A) Quantification of the percentage of GABAergic neurons (GABA+) over the total nuclei (DAPI+) number, at 17 days. Values are means±S.E.M (N = 3). At 17 days, the percentage of GABA+ cells significantly decreased in 1% O2 and 20% O2 with respect to mild hypoxia conditions. (B) Quantification of the percentage of glutamatergic neurons (GLUTA+) over the total nuclei (DAPI+) number at 17 days. Values are means±S.E.M (N = 3). At 17 days the percentage of GLUTA+ cells was significantly higher in hypoxic conditions with respect to 20% O2. The differences among all the values at 1%, 2.5%, 5% and 20% oxygen was statistically significant (P<0.01) unless indicated (*P<0.05, n.s., = not significant); one-way ANOVA followed by the Student's t-test for all experiments. (C–D) Immunostaining showing the morphology of GABA+ cells (C, green) and GLUTA+ cells (D, green) in 2.5% O2 at 17 days. Scale bars 10µm.
Figure 8
Figure 8. Hypoxia impairs differentiation of IhNSCs.
IhNSCs were differentiated onto an adhesive substrate in medium without mitogens and fixed for immunocytochemical analysis at 3, 10 and 17 days. (A–B) Immunostaining showing the non co-localization between the neuronal marker β-tubIII (green) and nestin (red) in IhNSC cells at 10 days in 1% (A) and 2,5% (B) O2. (C) Western blot analysis of the variation of nestin (arrows), during differentiation. Lysates were prepared from IhNSCs grown and differentiated for 3 and 10 days at the indicated oxygen concentrations. Lysates were immunoblotted with antibodies specific for nestin and GADPH, the latter to normalize bands for equal loading of proteins per lane. Bands were quantified by densitometry analysis of the ECL-exposed films. (D–G) Immunostaining showing the co-localization (D, yellow) between GFAP (green) and nestin in cells at 10 days in 1% O2. The two markers never showed colocalization at 2,5% (E) and 5% (F) O2 at the same time point, and only few cells were co-expressing the two markers at 20% O2 (G, yellow). (H–I) Immunostaining showing the non co-localization between the neuronal marker β-tubIII (red) and vimentin (green) in IhNSC cells at 10 days in 1% (H) and 2,5% (I) O2. Scale bars, (A–B, D–G) 20µm, (H,I) 10 µm.

Similar articles

Cited by

References

    1. Vescovi AL, Parati EA, Gritti A, Poulin P, Ferrario M, et al. Isolation and cloning of multipotential stem cells from the embryonic human CNS and establishment of transplantable human neural stem cell lines by epigenetic stimulation. Exp Neurol. 1999;156:71–83. - PubMed
    1. McKay R. Stem cells in the central nervous system. Science. 1997;276:66–71. - PubMed
    1. Gritti A, Parati EA, Cova L, Frolichsthal P, Galli R, et al. Multipotential stem cells from the adult mouse brain proliferate and self-renew in response to basic fibroblast growth factor. J Neurosci. 1996;16:1091–1100. - PMC - PubMed
    1. Gritti A, Frolichsthal-Schoeller P, Galli R, Parati EA, Cova L, et al. Epidermal and fibroblast growth factors behave as mitogenic regulators for a single multipotent stem cell-like population from the subventricular region of the adult mouse forebrain. J Neurosci. 1999;19:3287–3297. - PMC - PubMed
    1. Gritti A, Cova L, Parati EA, Galli R, Vescovi AL. Basic fibroblast growth factor supports the proliferation of epidermal growth factor-generated neuronal precursor cells of the adult mouse CNS. Neurosci Lett. 1995;185:151–154. - PubMed

Publication types