. 2009 Oct 2;9(11):1.1-13.
doi: 10.1167/9.11.1.

Averaging facial expression over time

Affiliations

Averaging facial expression over time

Jason Haberman et al. J Vis. .

Abstract

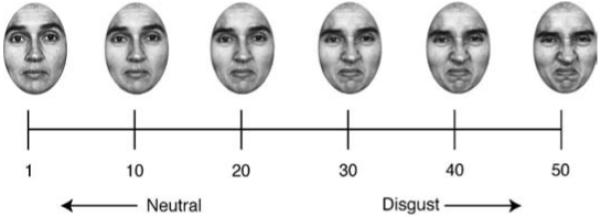
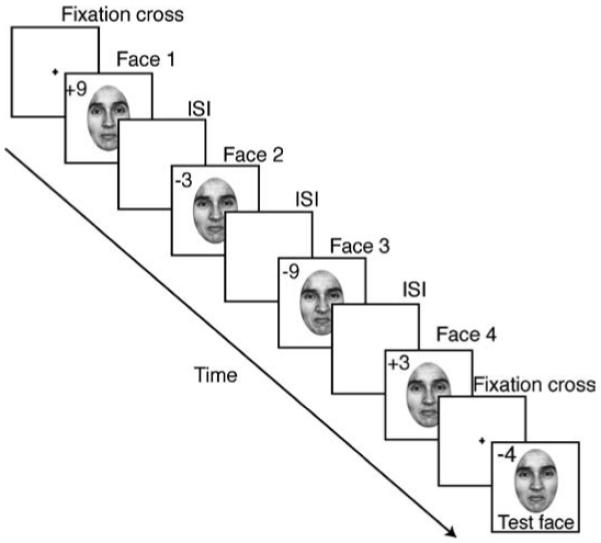
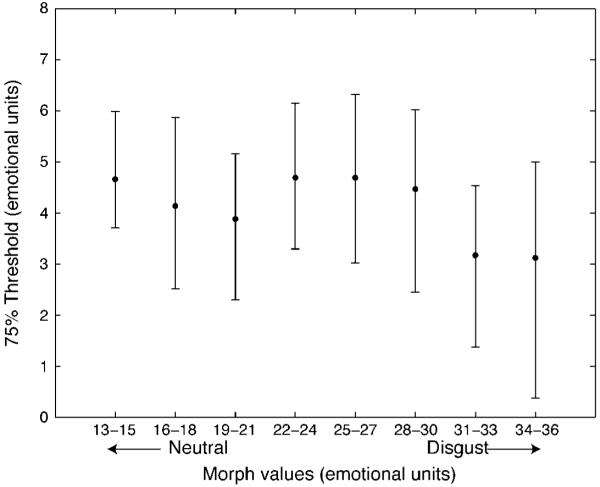
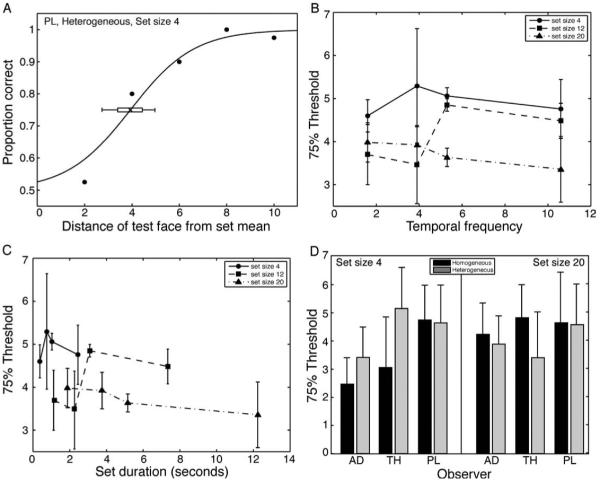
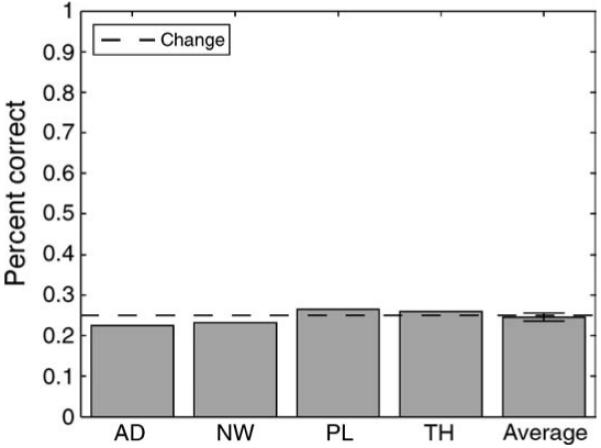
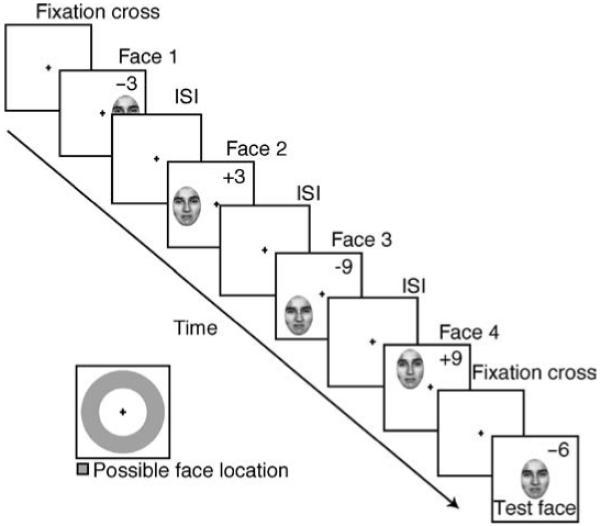
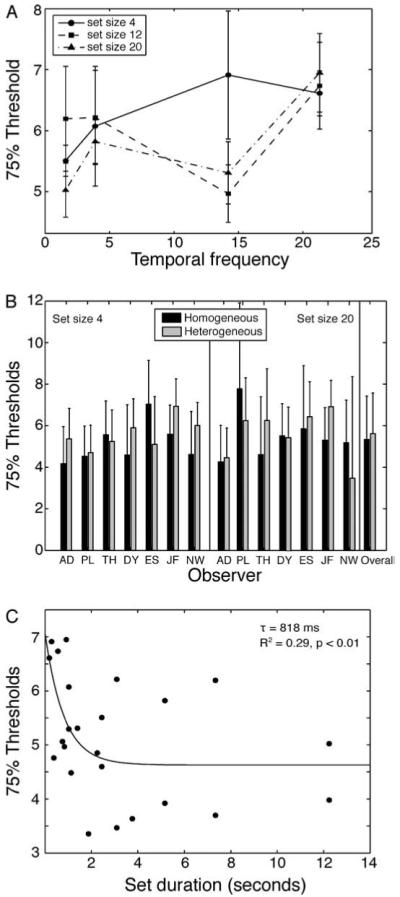
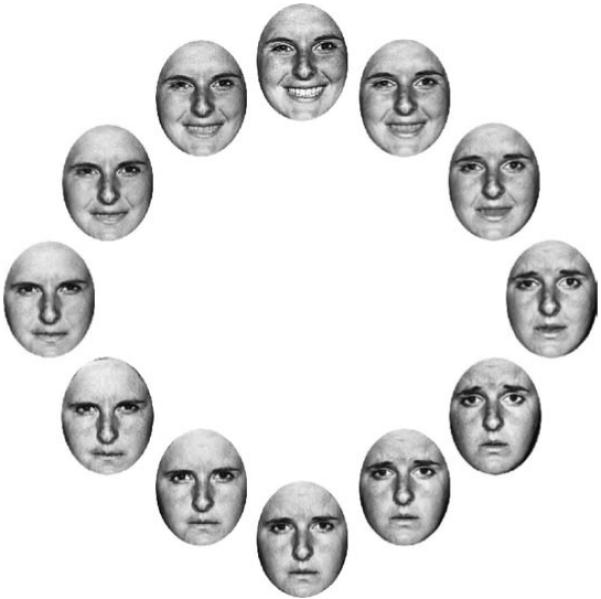
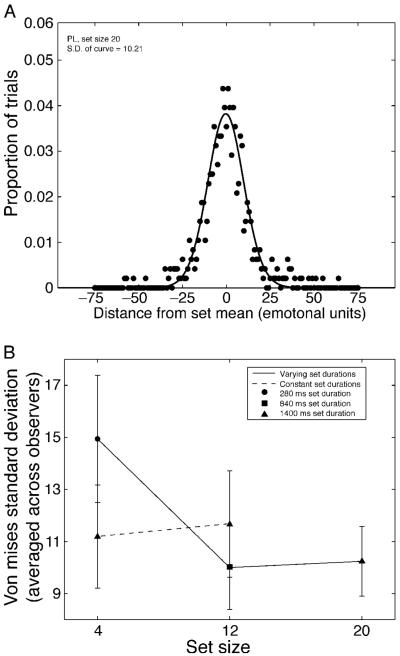
The visual system groups similar features, objects, and motion (e.g., Gestalt grouping). Recent work suggests that the computation underlying perceptual grouping may be one of summary statistical representation. Summary representation occurs for low-level features, such as size, motion, and position, and even for high level stimuli, including faces; for example, observers accurately perceive the average expression in a group of faces (J. Haberman & D. Whitney, 2007, 2009). The purpose of the present experiments was to characterize the time-course of this facial integration mechanism. In a series of three experiments, we measured observers' abilities to recognize the average expression of a temporal sequence of distinct faces. Faces were presented in sets of 4, 12, or 20, at temporal frequencies ranging from 1.6 to 21.3 Hz. The results revealed that observers perceived the average expression in a temporal sequence of different faces as precisely as they perceived a single face presented repeatedly. The facial averaging was independent of temporal frequency or set size, but depended on the total duration of exposed faces, with a time constant of approximately 800 ms. These experiments provide evidence that the visual system is sensitive to the ensemble characteristics of complex objects presented over time.


Figures

Figure 1
Figure 1
Morph range. We created a stimulus set containing 50 morphed faces ranging from extremely neutral to extremely disgusted. Numbers represent “emotional units.”
Figure 2
Figure 2
Task sequence for Experiment 1. Observers viewed a series of faces presented at various temporal frequencies (1.6, 3.9, 5.3, 10.6 Hz, 50% duty cycle). The number of faces in the sequence varied from among 4, 12, and 20 items. The sequence was followed by a test face that remained on the screen until response was received. The numbers indicate the distance (in emotional units) of each face relative to the mean expression of the set. The mean and the order of face presentation were randomized on each trial. Numbers were not visible to participants. ISI, interstimulus interval.
Figure 3
Figure 3
75% discrimination thresholds (in emotional units). In a control study, observers indicated whether a test face was more or less disgusted than the preceding sequence of homogeneous faces. Sensitivity did not differ as a function of morph value. Error bars based on 5000 bootstrapped estimates.
Figure 4
Figure 4
Experiment 1A results. (A) Representative psychometric function. For each observer and condition, 75% thresholds were derived. The threshold averaged across observers is depicted in (B), plotted as a function of temporal frequency. (C) 75% thresholds replotted as a function of overall set duration. (D) Results of the control experiment, showing 75% thresholds on homogeneous (identical faces) and heterogeneous sets of faces for each observer. Performance did not differ between the two tasks for either set size 4 or 20. Error bars in (A) are 95% confidence intervals derived from bootstrapping 5000 curve fitting simulations. Error bars in (B-D) represent ± one standard error of the mean (SEM).
Figure 5
Figure 5
Experiment 1B results. Observers were at chance in identifying where in the sequence of faces a particular test face appeared. This suggests they lacked or lost information about the individual set members and instead favored a mean representation. Error bar denotes SEM.
Figure 6
Figure 6
Task sequence for Experiment 2. Observers fixated a central cross while a sequence of faces was presented randomly on an invisible, isoeccentric ring. Faces were randomly presented at 1.6, 3.9, 14.2, or 21.3 Hz, at set sizes of 4, 12, or 20. The set was followed by a test face that remained on the screen until a response was received. Numbers indicate the distance (in emotional units) each face was from the mean expression, although the sequence (mean expression) was randomized on every trial. Numbers were not visible to participants.
Figure 7
Figure 7
Experiment 2 results. (A) 75% thresholds as a function of temporal frequency, separated by set size. (B) Results of the control experiment, showing 75% thresholds on homogeneous (identical) and heterogeneous sets of faces for each observer on set size 4 and 20, along with overall performance collapsed across set size. Performance did not differ between the two tasks. Note that the large error bar for observer PL occurred for homogeneous discrimination. (C) Decay function fit to 75% thresholds derived from Experiments 1 and 2 reveals an improvement in sensitivity to average expression with increasing exposure to the set of faces. The time constant of the integration was 818 ms, defined as the point on the curve at which performance reached 63% of the asymptotic sensitivity. Error bars in (A) and (B) are ±1 SEM.
Figure 8
Figure 8
Stimuli in Experiment 3. A set of faces was morphed from happy to sad to angry and back to happy again to create a “circle” of facial expression. After viewing a sequence of faces (similar to Experiment 2, see methods in Experiment 3 for details), observers saw a single test face they adjusted to match the mean expression of the previously displayed set.
Figure 9
Figure 9
Experiment 3 results. (A) One representative participant’s adjustment curve. Depicted is the proportion of times this observer selected a face n units from the mean (shown here as 0). A Von Mises curve was fit to the data, and the standard deviation of the curve calculated. The smaller the standard deviation is, the narrower the distribution and the more precise the mean representation. (B) Standard deviation of the Von Mises distribution, calculated separately for each observer and then averaged. The solid line indicates Von Mises standard deviation as a function of set size, when temporal frequency was fixed (14.2 Hz for each set size; bigger set sizes mean longer overall set durations; see legend for specific set durations). The dashed line indicates the same, except that overall set duration was fixed (i.e. different temporal frequencies for each set size). The results reveal that sensitivity to average facial expression was fairly constant when overall set duration was equated (triangle symbols).

Similar articles

Cited by

References

    1. Albrecht A, Scholl B. Perceptually averaging in a continuous world: Extracting statistical summary representations over times. Psychological Science. in press. - PubMed
    1. Alvarez GA, Oliva A. The representation of simple ensemble visual features outside the focus of attention. Psychological Science. 2008;19:392–398. - PMC - PubMed
    1. Ariely D. Seeing sets: Representation by statistical properties. Psychological Science. 2001;12:157–162. - PubMed
    1. Beck J. Textural segmentation, 2nd-order statistics, and textural elements. Biological Cybernetics. 1983;48:125–130. - PubMed
    1. Blake R, Lee SH. The role of temporal structure in human vision. Behavioural Cognitive Neuroscience Review. 2005;4:21–42. - PubMed

Publication types