

Dissociable effects of attention and crowding on orientation averaging
- PMID: 20053091
- PMCID: PMC2927104
- DOI: 10.1167/9.11.28
Dissociable effects of attention and crowding on orientation averaging
Abstract
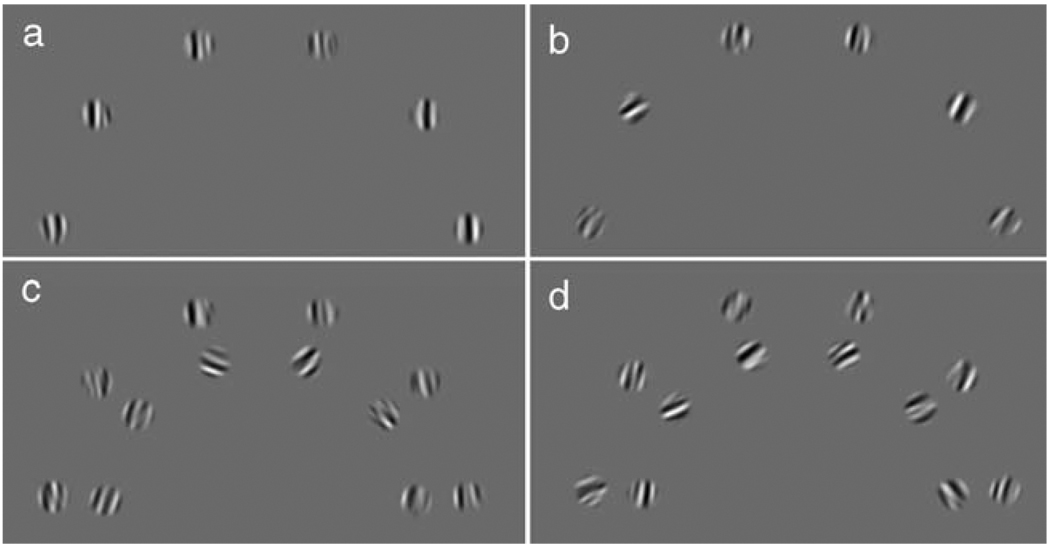
It has been proposed that visual crowding-the breakdown in recognition that occurs when objects are presented in cluttered scenes-reflects a limit imposed by visual attention. We examined this idea in the context of an orientation averaging task, having subjects judge the mean orientation of a set of oriented signal elements either in isolation, or "crowded" by nearby randomly oriented elements. In some conditions, subjects also had to perform an attentionally demanding secondary task. By measuring performance at different levels of signal orientation variability, we show that crowding increases subjects' local uncertainty (about the orientation of individual elements) but that diverting attention reduces their global efficiency (the effective number of elements they can average over). Furthermore, performance with the same stimulus-sequence, presented multiple times, reveals that crowding does not induce more stimulus-independent variability (as would be predicted by some accounts based on attention). We conclude that crowding and attentional load have dissociable perceptual consequences for orientation averaging, suggesting distinct neural mechanisms for both. For the task we examined, attention can modulate the effects of crowding by changing the efficiency with which information is analyzed by the visual system but since crowding changes local uncertainty, not efficiency, crowding does not reflect an attentional limit.
Figures


Similar articles
-
The role of crowding in contextual influences on contour integration.J Vis. 2012 Jul 9;12(7):3. doi: 10.1167/12.7.3. J Vis. 2012. PMID: 22776847
-
Contextual-Dependent Attention Effect on Crowded Orientation Signals in Human Visual Cortex.J Neurosci. 2018 Sep 26;38(39):8433-8440. doi: 10.1523/JNEUROSCI.0805-18.2018. Epub 2018 Aug 17. J Neurosci. 2018. PMID: 30120209 Free PMC article.
-
Attentional priming releases crowding.Atten Percept Psychophys. 2013 Oct;75(7):1323-9. doi: 10.3758/s13414-013-0558-2. Atten Percept Psychophys. 2013. PMID: 24092360
-
The effect of spacing regularity on visual crowding.J Vis. 2010 Aug 18;10(10):17. doi: 10.1167/10.10.17. J Vis. 2010. PMID: 20884482
-
Sequential ideal-observer analysis of visual discriminations.Psychol Rev. 1989 Apr;96(2):267-314. doi: 10.1037/0033-295x.96.2.267. Psychol Rev. 1989. PMID: 2652171 Review.
Cited by
-
Allocation of attention during pursuit of large objects is no different than during fixation.J Vis. 2015;15(9):9. doi: 10.1167/15.9.9. J Vis. 2015. PMID: 26200890 Free PMC article.
-
Microsaccadic correlates of covert attention and crowding.J Vis. 2022 Sep 2;22(10):15. doi: 10.1167/jov.22.10.15. J Vis. 2022. PMID: 36121661 Free PMC article.
-
Probabilistic, positional averaging predicts object-level crowding effects with letter-like stimuli.J Vis. 2010 Aug 1;10(10):14. doi: 10.1167/10.10.14. J Vis. 2010. PMID: 20884479 Free PMC article.
-
The Role of Feature Tracking in the Furrow Illusion.Front Hum Neurosci. 2016 Mar 7;10:81. doi: 10.3389/fnhum.2016.00081. eCollection 2016. Front Hum Neurosci. 2016. PMID: 27014018 Free PMC article.
-
Visual crowding: a fundamental limit on conscious perception and object recognition.Trends Cogn Sci. 2011 Apr;15(4):160-8. doi: 10.1016/j.tics.2011.02.005. Epub 2011 Mar 21. Trends Cogn Sci. 2011. PMID: 21420894 Free PMC article. Review.
References
-
- Ahumada AJ, Jr, Lovell J. Stimulus features in signal detection. Journal of the Acoustical Society of America. 1971;49:1751–1756.
-
- Barlow HB. Retinal noise and absolute threshold. Journal of the Optical Society of America. 1956;46:634–639. - PubMed
-
- Bex PJ, Dakin SC. Spatial interference among moving targets. Vision Research. 2005;45:1385–1398. - PubMed
-
- Bex PJ, Dakin SC, Simmers AJ. The shape and size of crowding for moving targets. Vision Research. 2003;43:2895–2904. - PubMed
Publication types
MeSH terms
Grants and funding
LinkOut - more resources
Full Text Sources
