Latency characteristics of the short-wavelength-sensitive cones and their associated pathways
- PMID: 20053096
- PMCID: PMC2861861
- DOI: 10.1167/9.12.5
Latency characteristics of the short-wavelength-sensitive cones and their associated pathways
Abstract
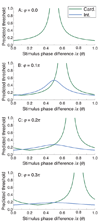
There are many distinct types of retinal ganglion and LGN cells that have opponent cone inputs and which may carry chromatic information. Of interest are the asymmetries in those LGN cells that carry S-cone signals: in S-ON cells, S+ signals are opposed by (L + M) whereas, in many S-OFF cells, L+ signals are opposed by (S + M), giving -S + L - M (C. Tailby, S. G. Solomon, & P. Lennie, 2008). However, the S-opponent pathway is traditionally modeled as +/-[S - (L + M)]. A phase lag of the S-cone signal has been inferred from psychophysical thresholds for discriminating combinations of simultaneous sinusoidal modulations along +/-[L - M] and +/-[S - (L + M)] directions (C. F. Stromeyer, R. T. Eskew, R. E. Kronauer, & L. Spillmann, 1991). We extend this experiment, measuring discrimination thresholds as a function of the phase delay between pairs of orthogonal component modulations. When one of the components isolates the tritan axis, there are phase delays at which discrimination is impossible; when neither component is aligned with the tritan axis, discrimination is possible at all delays. The data imply that the S-cone signal is delayed by approximately 12 ms relative to (L - M) responses. Given that post-receptoral mechanisms show diverse tuning around the tritan axis, we suggest that the delay arises before the S-opponent channels are constructed, possibly in the S-cones themselves.
Figures


Similar articles
-
Connectomic Identification and Three-Dimensional Color Tuning of S-OFF Midget Ganglion Cells in the Primate Retina.J Neurosci. 2019 Oct 2;39(40):7893-7909. doi: 10.1523/JNEUROSCI.0778-19.2019. Epub 2019 Aug 12. J Neurosci. 2019. PMID: 31405926 Free PMC article.
-
Distinct synaptic mechanisms create parallel S-ON and S-OFF color opponent pathways in the primate retina.Vis Neurosci. 2014 Mar;31(2):139-51. doi: 10.1017/S0952523813000230. Epub 2013 Jul 29. Vis Neurosci. 2014. PMID: 23895762 Free PMC article. Review.
-
Sensitivity of macaque retinal ganglion cells to chromatic and luminance flicker.J Physiol. 1989 Jul;414:223-43. doi: 10.1113/jphysiol.1989.sp017685. J Physiol. 1989. PMID: 2607430 Free PMC article.
-
Is the S-opponent chromatic sub-system sluggish?Vision Res. 2004 Nov;44(25):2919-29. doi: 10.1016/j.visres.2004.06.022. Vision Res. 2004. PMID: 15380996
-
Processing of the S-cone signals in the early visual cortex of primates.Vis Neurosci. 2014 Mar;31(2):189-95. doi: 10.1017/S0952523813000278. Epub 2013 Aug 13. Vis Neurosci. 2014. PMID: 23941664 Free PMC article. Review.
Cited by
-
Human visual gamma for color stimuli.Elife. 2022 May 9;11:e75897. doi: 10.7554/eLife.75897. Elife. 2022. PMID: 35532123 Free PMC article.
-
Unique yellow shifts for small and brief stimuli in the central retina.J Vis. 2024 Jun 3;24(6):2. doi: 10.1167/jov.24.6.2. J Vis. 2024. PMID: 38833255 Free PMC article.
-
Blue Light Protects Against Temporal Frequency Sensitive Refractive Changes.Invest Ophthalmol Vis Sci. 2015 Sep;56(10):6121-31. doi: 10.1167/iovs.15-17238. Invest Ophthalmol Vis Sci. 2015. PMID: 26393671 Free PMC article.
-
S-cone photoreceptors in the primate retina are functionally distinct from L and M cones.Elife. 2019 Jan 23;8:e39166. doi: 10.7554/eLife.39166. Elife. 2019. PMID: 30672735 Free PMC article.
-
Aging of human short-wave cone pathways.Proc Natl Acad Sci U S A. 2012 Aug 14;109(33):13422-7. doi: 10.1073/pnas.1119770109. Epub 2012 Jul 30. Proc Natl Acad Sci U S A. 2012. PMID: 22847416 Free PMC article.
References
-
- Blake Z, Land T, Mollon J. Relative latencies of cone signals measured by a moving vernier task. Journal of Vision. 2008;8(16):1–11. 16, doi:10.1167/8.16.16, http://journalofvision.org/8/16/16/. [PubMed] [Article] - PubMed
-
- Bompas A, Sumner P. Sensory sluggishness dissociates saccadic, manual, and perceptual responses: An S-cone study. Journal of Vision. 2008;8(8):1–13. 10, doi:10.1167/8.8.10, http://journalofvision.org/8/8/10/. [PubMed] [Article] - PubMed
-
- Calkins DJ, Sterling P. Evidence that circuits for spatial and color vision segregate at the first retinal synapse. Neuron. 1999;24:313–321. [PubMed] - PubMed
-
- Chatterjee S, Callaway EM. S cone contributions to the magnocellular visual pathway in macaque monkey. Neuron. 2002;35:1135–1146. [PubMed] - PubMed
-
- Chen CC, Foley JM, Brainard DH. Detection of chromoluminance patterns on chromo-luminance pedestals II: Model. Vision Research. 2000;40:789–803. [PubMed] - PubMed
Publication types
MeSH terms
Grants and funding
LinkOut - more resources
Full Text Sources
Miscellaneous

