. 2009 Nov 19;9(12):13.1-18.
doi: 10.1167/9.12.13.

A summary-statistic representation in peripheral vision explains visual crowding

Affiliations

A summary-statistic representation in peripheral vision explains visual crowding

Benjamin Balas et al. J Vis. .

Abstract

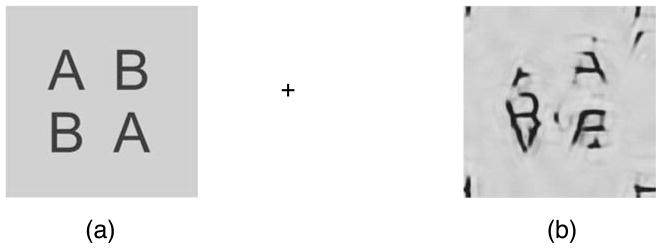
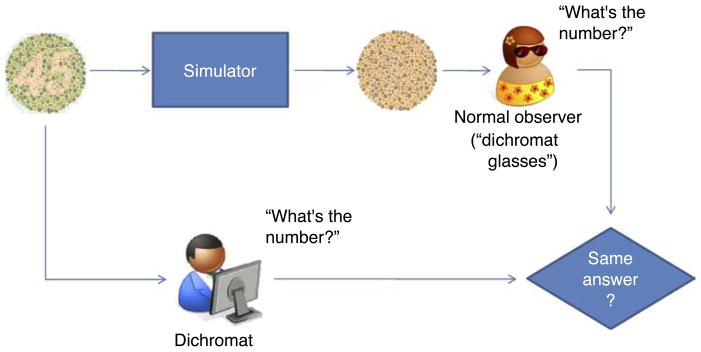
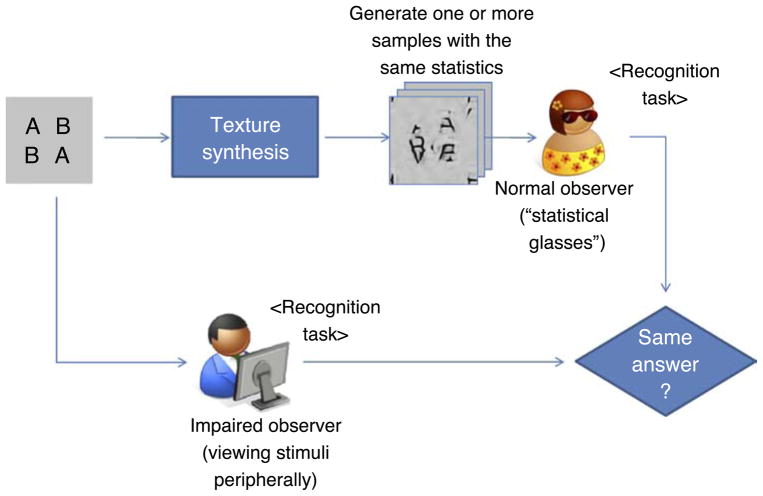
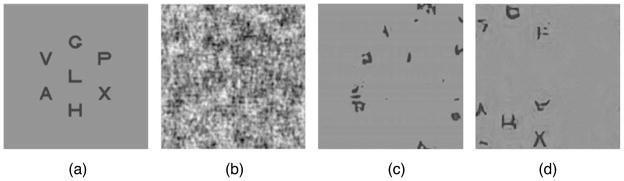
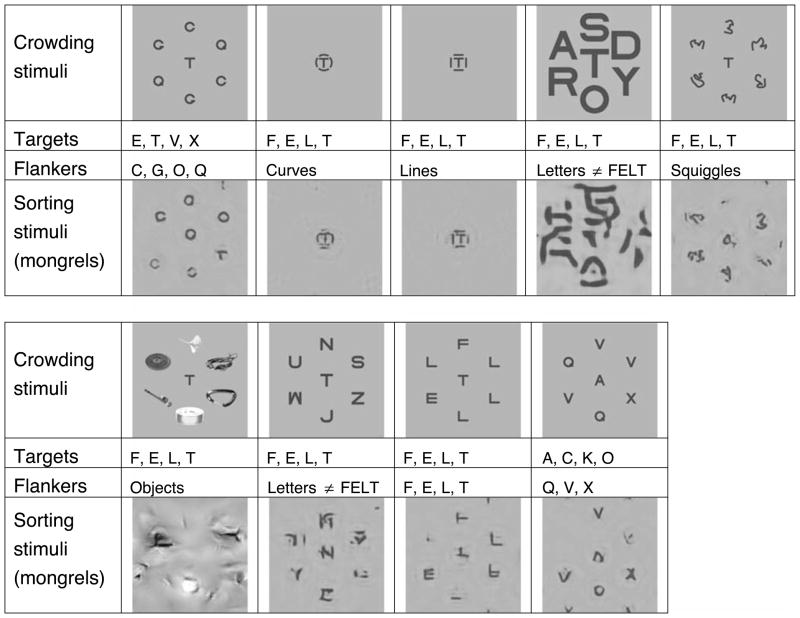
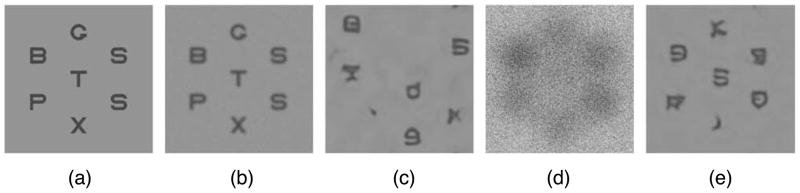
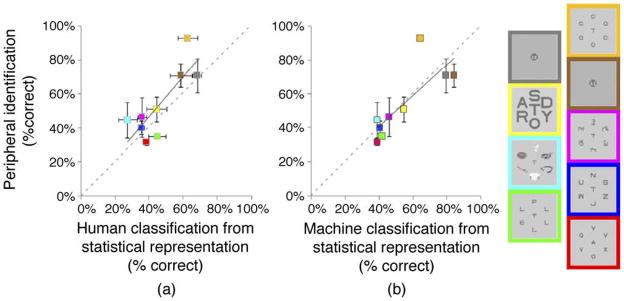
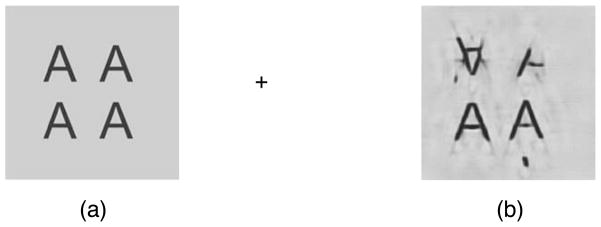
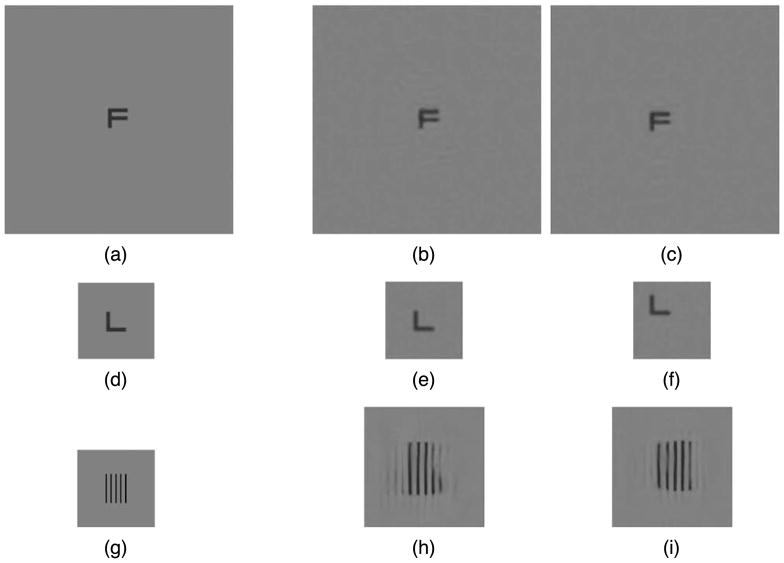
Peripheral vision provides a less faithful representation of the visual input than foveal vision. Nonetheless, we can gain a lot of information about the world from our peripheral vision, for example in order to plan eye movements. The phenomenon of crowding shows that the reduction of information available in the periphery is not merely the result of reduced resolution. Crowding refers to visual phenomena in which identification of a target stimulus is significantly impaired by the presence of nearby stimuli, or flankers. What information is available in the periphery? We propose that the visual system locally represents peripheral stimuli by the joint statistics of responses of cells sensitive to different position, phase, orientation, and scale. This "textural" representation by summary statistics predicts the subjective "jumble" of features often associated with crowding. We show that the difficulty of performing an identification task within a single pooling region using this representation of the stimuli is correlated with peripheral identification performance under conditions of crowding. Furthermore, for a simple stimulus with no flankers, this representation can be adequate to specify the stimulus with some position invariance. This provides evidence that a unified neuronal mechanism may underlie peripheral vision, ordinary pattern recognition in central vision, and texture perception. A key component of our methodology involves creating visualizations of the information available in the summary statistics of a stimulus. We call these visualizations "mongrels" and show that they are highly useful in examining how the early visual system represents the visual input. Mongrels enable one to study the "equivalence classes" of our model, i.e., the sets of stimuli that map to the same representation according to the model.


Figures

Figure 1
Figure 1
The phenomenon of crowding. The letter “G” on the left is clearly identifiable in the periphery, when fixating on the “+”. However, the presence of flanking letters makes recognition of the “G” on the right quite difficult.
Figure 2
Figure 2
(a) Crowded, when fixating on the “+”. (b) A sample mongrel for (a). This visualization of the crowded percept shows the expected mixing of features while preserving sharp edges and high contrast.
Figure 3
Figure 3
A flowchart representation of a method for verifying a model of dichromacy. A true dichromat performs a task with a given stimulus set, while a normal observer performs that task with stimuli manipulated to reflect what information is lost in the model. If performance of the observers agrees, the model is a useful characterization of dichromacy.
Figure 4
Figure 4
We test the efficacy of our statistical model of peripheral vision by the same methodology outlined in Figure 3. One set of observers views “crowded” arrays peripherally and performs a 4AFC letter recognition task (see text for details). Others do the same task while viewing “mongrels.” Critically, these observers foveate the stimuli for unlimited time, making the loss of information due to a statistical representation the prime limiting factor on their performance.
Figure 5
Figure 5
Visualization of the information captured by different choices of summary statistics. (a) Original stimulus. Panels (b)–(d) use a pooling region that covers the entire stimulus. (b) The power spectrum of (a), with random phase. These global statistics poorly capture local structure. (c) Marginal statistics of both the responses of V1-like oriented filters and of intensity values, as in Heeger and Bergen (1995). (d) Marginal distribution of the luminance, joint statistics of responses of V1-like oriented filters, luminance autocorrelation, and phase correlation across scale, as in Portilla and Simoncelli (2000). Both (c) and (d) capture some of the local structure in the original, with (d) capturing more extended structures. We initialized both (c) and (d) with a random seed. These examples do not include a blur to account for peripheral loss of acuity.
Figure 6
Figure 6
Sample stimuli for the crowding and sorting experiments. The top row shows a sample stimulus from the crowding experiment. The middle two rows specify the 4 possible targets for each condition and the flankers. The bottom row shows a sample mongrel for the corresponding sorting task. Conditions are shown in order of mean difficulty on the crowding task, from easiest (top left) to most difficult (bottom right).
Figure 7
Figure 7
The mongrelization process. (a) The original crowded display. (b) Blurred original (to account for reduced acuity), with added noise; the input to the texture analysis routine. (c) Mongrel created starting with a random noise seed. (d) Seed consisting of a low-pass version of the original plus random noise, shown at 8× contrast. (e) The mongrel resulting from the seed in (d).
Figure 8
Figure 8
Each square represents a different crowding condition. The conditions, in order of difficulty, are shown in Figure 5. (a) Correlation between human performance at identifying peripheral targets under conditions of crowding tasks, and human performance sorting foveally viewed mongrels according to likely target identity. (b) Correlation between human performance identifying peripheral, crowded targets, and machine classification performance upon a vector of statistics measured in each crowded stimulus.
Figure 9
Figure 9
The letters in (a) are within the critical spacing for crowding, when fixating on the “+”. (b) A sample mongrel. Note that (b) contains an inverted “A” despite a homogeneous input of upright A’s. This unexpected result predicts that it should be difficult to distinguish homogenous arrays from those containing inverted A’s under crowding, which was confirmed by pilot data.
Figure 10
Figure 10
(a) An uncrowded “F”, viewed peripherally (large pooling region). (b, c) Associated mongrels, sharing the same joint statistics as the original (a), and thus belonging to the equivalence class of (a), according to our model. (d) A simple stimulus, with a small pooling region (the size of the image), e.g., as in foveal viewing. Members of the equivalence class are shown by the mongrels in (e) and (f). Note that in both cases (a, d), the statistics are sufficient to describe the stimulus up to a translation. Thus the model can likely identify isolated stimulus letters in the periphery, as well as in the “fovea.” (g) Original image of 5 bars, and (h, i) associated mongrels. Note the apparent difference in the number of bars in (h) and (i), and the ghostly extra bars flanking the higher contrast ones. The mongrels correctly predict uncertainty about the number of bars present. Thus our model can even predict where “normal” object recognition breaks in the fovea. (The mongrels in (h) and (i) have been enlarged for clearer viewing.)
Figure A1
Figure A1
(a) A sample texture drawn from the Brodatz database. This is a sample of reptile skin. (b) Reptile skin synthesized using the full set of statistics from Portilla and Simoncelli (2000).
Figure A2
Figure A2
Synthesized reptile skin. Each of these samples was synthesized without constraining one of the sets of statistics from Portilla and Simoncelli (2000). Compare each sample with Figure A1b to get a sense of what information is captured by the missing statistics. (a) No constraint on the distribution of pixel intensities. The overall appearance of the texture is fairly accurate, but the contrast and brightness are obviously incorrect. (b) No constraint on the local periodicity (autocorrelation). While much of the structure is still evident (individual cells are still observable, for example) the global arrangement of cells into a repeated pattern is less evident. (c) No constraint on the magnitude correlation statistics. Here, while some aspects of the periodic structure are evident, the structure of individual cells is not preserved. (d) No constraint on the relative phase statistics. Note the contrast-polarity errors throughout the image: some cells have a light interior while others have a black interior.

Similar articles

Cited by

References

    1. Andriessen JJ, Bouma H. Eccentric vision: Adverse interactions between line segments. Vision Research. 1976;16:71–78. - PubMed
    1. Anstis SM. Letter: A chart demonstrating variations in acuity with retinal position. Vision Research. 1974;14:589–592. - PubMed
    1. Balas BJ. Texture synthesis and perception: Using computational models to study texture representations in the human visual system. Vision Research. 2006;46:299–309. - PubMed
    1. Beck J. Textural segmentation, second-order statistics, and textural elements. Biological Cybernetics. 1983;48:125–130. - PubMed
    1. Brettel H, Viénot F, Mollon JD. Computerized simulation of color appearance for dichromats. Journal of the Optical Society of America A, Optics, Image Science, and Vision. 1997;14:2647–2655. - PubMed

Publication types