

Oculomotor responses and visuospatial perceptual judgments compete for common limited resources
- PMID: 20053112
- PMCID: PMC2852532
- DOI: 10.1167/9.12.21
Oculomotor responses and visuospatial perceptual judgments compete for common limited resources
Abstract
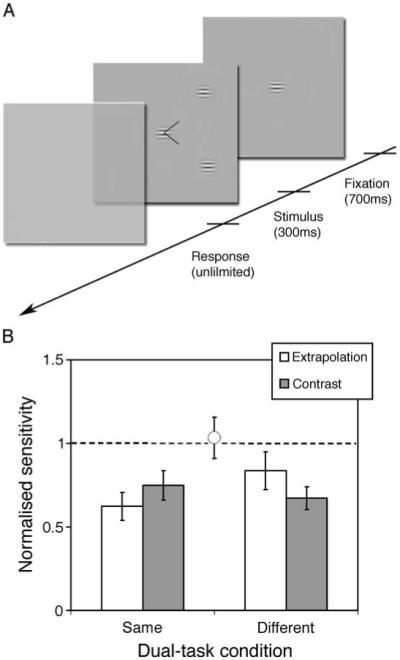
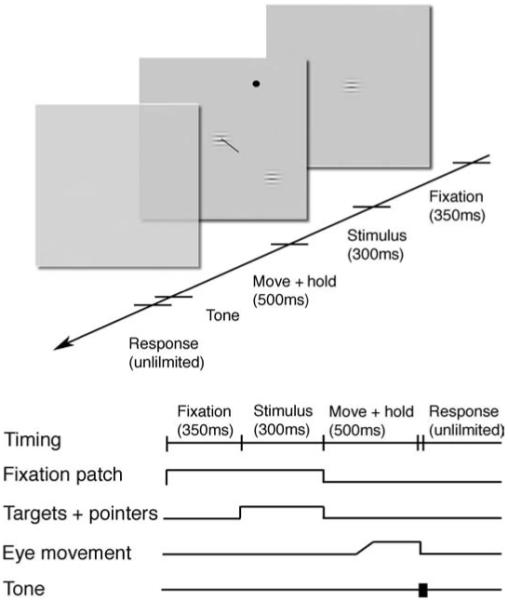
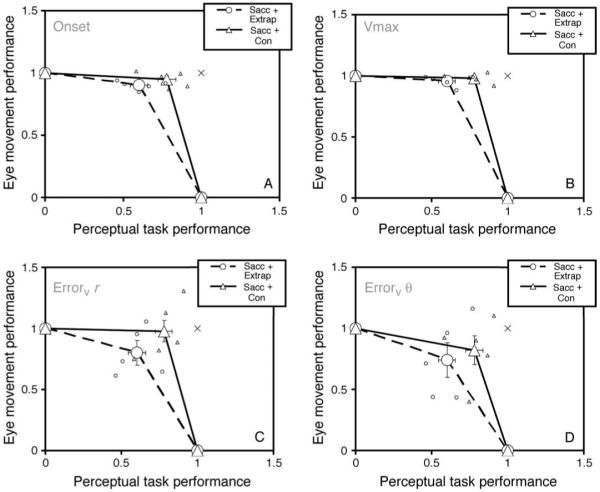
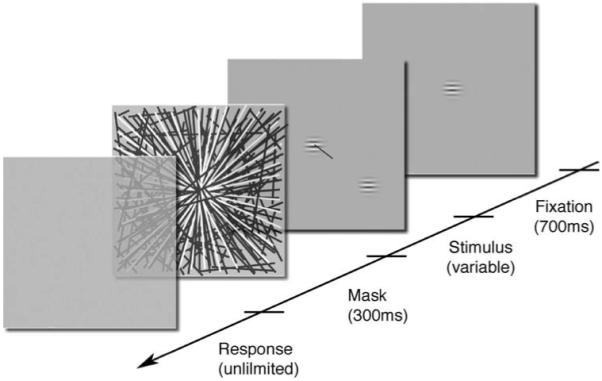
While there is evidence for multiple spatial and attentional maps in the brain it is not clear to what extent visuoperceptual and oculomotor tasks rely on common neural representations and attentional mechanisms. Using a dual-task interference paradigm we tested the hypothesis that eye movements and perceptual judgments made to simultaneously presented visuospatial information compete for shared limited resources. Observers undertook judgments of stimulus collinearity (perceptual extrapolation) using a pointer and Gabor patch and/or performed saccades to a peripheral dot target while their eye movements were recorded. In addition, observers performed a non-spatial control task (contrast discrimination), matched for task difficulty and stimulus structure, which on the basis of previous studies was expected to represent a lesser load on putative shared resources. Greater mutual interference was indeed found between the saccade and extrapolation task pair than between the saccade and contrast discrimination task pair. These data are consistent with visuoperceptual and oculomotor responses competing for common limited resources as well as spatial tasks incurring a relatively high attentional cost.
Figures
Similar articles
-
Prior information and oculomotor initiation: the effect of cues in gaps.Exp Brain Res. 2009 Jan;192(1):75-85. doi: 10.1007/s00221-008-1556-9. Epub 2008 Sep 2. Exp Brain Res. 2009. PMID: 18762927
-
Target-distractor competition in the oculomotor system is spatiotopic.J Neurosci. 2014 May 7;34(19):6687-91. doi: 10.1523/JNEUROSCI.4453-13.2014. J Neurosci. 2014. PMID: 24806694 Free PMC article.
-
The neural correlates of visuospatial perceptual and oculomotor extrapolation.PLoS One. 2010 Mar 15;5(3):e9664. doi: 10.1371/journal.pone.0009664. PLoS One. 2010. PMID: 20300627 Free PMC article.
-
The influence of spatial congruency and movement preparation time on saccade curvature in simultaneous and sequential dual-tasks.Vision Res. 2015 Nov;116(Pt A):25-35. doi: 10.1016/j.visres.2015.09.006. Epub 2015 Sep 29. Vision Res. 2015. PMID: 26410291
-
Visual and oculomotor selection: links, causes and implications for spatial attention.Trends Cogn Sci. 2006 Mar;10(3):124-30. doi: 10.1016/j.tics.2006.01.001. Epub 2006 Feb 15. Trends Cogn Sci. 2006. PMID: 16469523 Review.
Cited by
-
Effects of old age and resource demand on double-step adaptation of saccadic eye movements.Exp Brain Res. 2014 Sep;232(9):2821-6. doi: 10.1007/s00221-014-3969-y. Epub 2014 May 4. Exp Brain Res. 2014. PMID: 24792506
-
The role of saccades in multitasking: towards an output-related view of eye movements.Psychol Res. 2011 Nov;75(6):452-65. doi: 10.1007/s00426-011-0352-5. Epub 2011 Jul 1. Psychol Res. 2011. PMID: 21720887 Review.
-
Rapid eye movements to a virtual target are biased by illusory context in the Poggendorff figure.Exp Brain Res. 2015 Jul;233(7):1993-2000. doi: 10.1007/s00221-015-4263-3. Epub 2015 Apr 26. Exp Brain Res. 2015. PMID: 25912606 Free PMC article.
-
Interaction of oculomotor and manual behavior: evidence from simulated driving in an approach-avoidance steering task.Cogn Res Princ Implic. 2019 Jun 13;4(1):19. doi: 10.1186/s41235-019-0170-7. Cogn Res Princ Implic. 2019. PMID: 31197485 Free PMC article.
-
Investigating ideomotor cognition with motorvisual priming paradigms: key findings, methodological challenges, and future directions.Front Psychol. 2012 Nov 23;3:519. doi: 10.3389/fpsyg.2012.00519. eCollection 2012. Front Psychol. 2012. PMID: 23189067 Free PMC article.
References
-
- Altmann CF, Grodd W, Kourtzi Z, Bulthoff HH, Karnath HO. Similar cortical correlates underlie visual object identification and orientation judgment. Neuropsychologia. 2005;43:2101–2108. - PubMed
-
- Baldauf D, Deubel H. Properties of attenional selection during the preparation of sequential saccades. Experimental Brain Research. 2008;184:411–425. - PubMed
-
- Bonnel AM, Stein JF, Bertucci P. Does attention modulate the perception of luminance changes? Quarterly Journal of Experimental Psychology A, Human Experimental Psychology. 1992;44:601–626. - PubMed
-
- Brockmole JR, Carlson LA, Irwin DE. Inhibition of attended processing during saccadic eye movements. Perception & Psychophysics. 2002;64:867–881. - PubMed
Publication types
MeSH terms
Grants and funding
LinkOut - more resources
Full Text Sources
